Medical Waste Incinerators | Animal Crematory | Phone: +86-25-8461 0201 | Email: cloverincinerator@gmail.com
| Home | What is Incinerator | Incinerator Knowledge | Friendly Links | �� |
��
| �� |
Waste
treatment plant
Incineration Technology
Hospital waste incinerators
Emissions Tests on Medical Waste Incinerators
mobile animal carcass incinerator
incinerator specifically designed Information from Internet, Just as the industry knowledge, for readers, no commercial use. The copyright belongs to the original owner. We will delete if not agree. The Health Effects of Waste Incinerators 4th Report of the British Society for Ecological Medicine Second EditionJune 2008 Moderators: Dr Jeremy Thompson and Dr Honor Anthony Preface to Second Edition Since the publication of this report, important new data has been published strengthening the evidence that fine particulate pollution plays an important role in both cardiovascular and cerebrovascular mortality (see section 3.1) and demonstrating that the danger is greater than previously realised. More data has also been released on the dangers to health of ultrafine particulates and about the risks of other pollutants released from incinerators (see section 3.4). With each publication the hazards of incineration are becoming more obvious and more difficult to ignore. In the light of this data and the discussion provoked by our report, we have extended several sections. In particular, the section on alternative waste technologies (section 8) has been extensively revised and enlarged, as has that on the costs of incineration (section 9), the problems of ash (9.4), radioactivity (section 9.5), and the sections on monitoring (section 11), and risk assessment (section 12). We also highlight recent research which has demonstrated the very high releases of dioxin that arise during start-up and shut-down of incinerators (section 11). This is especially worrying as most assumptions about the safety of modern incinerators are based only on emissions which occur during standard operating conditions. Of equal concern is the likelihood that these dangerously high emissions will not be detected by present monitoring systems for dioxins. Foreword to the 1st Edition from Professor C. V. Howard. MB. ChB. PhD. FRCPath. The authors are to be congratulated on producing this report. The reader will soon understand that to come to a comprehensive understanding of the health problems associated with incineration it is essential to become acquainted with a large number of different disciplines ranging from aerosol physics to endocrine disruption to long range transport of pollutants. In most medical schools, to this day, virtually nothing is routinely taught to equip the medical graduate to approach these problems. This has to change. We need the medical profession to be educated to health consequences associated with current environmental degredation. There are no certainties in pinning specific health effects on incineration: the report makes that clear. However this is largely because of the complexity of exposure of the human race to many influences. The fact that 'proof' of cause and effect are hard to come by is the main defence used by those who prefer the status quo. However the weight of evidence, collected within this report, is sufficient in the authors' opinion to call for the phasing out of incineration as a way of dealing with our waste. I agree with that. There is also the question of sustainability. Waste destroyed in an incinerator will be replaced. That involves new raw materials, manufacture, transport, packaging etc etc. In contrast, reduction, reuse and recycling represent a win-win strategy. It has been shown in a number of different cities that high levels of diversion of waste (>60%) can be achieved relatively quickly. When that happens, there is not very much left to burn, but a number of the products left will be problematic, for example PVC. Incineration, an end of pipe approach, sends the message 'No problem, we have a solution for disposal of your product, carry on business as usual��. What should happen is a 'front end solution'. Society should be able to say 'Your product is unsustainable and a health hazard �� stop making it��. Incineration destroys accountability and this encourages industries to go on making products that lead to problematic toxic wastes. Once the waste has been reduced to ash who can say who made what? The past 150 years has seen a progressive 'toxification' of the waste stream with heavy metals, radionuclides and synthetic halogenated organic molecules. It is time to start reversing that trend. We won't achieve that while we continue to incinerate waste. Vyvyan Howard December 2005 Professor of Bioimaging, Centre for Molecular Biosciences,University of Ulster, Cromore Road, Coleraine, Co. Londonderry BT52 1SA Contents Executive Summary 1 Introduction 2. Emissions from Incinerators and other Combustion Sources 2.1 Particulates 2.2 Heavy metals 2.3 Nitrogen oxides 2.4 Organic pollutants 3. Health Effects of Pollutants 3.1 Particulates 3.2 Heavy metals 3.3 Nitrogen oxides and Ozone 3.4 Organic toxicants 3.5 Effects on genetic material 3.6 Effects on the immune system 3.7 Synergistic effects 4. Increased Morbidity and Mortality near Incinerators 4.1 Cancer 4.2 Birth defects 4.3 Ischemic heart disease 4.4 Comment 5. Disease Incidence and Pollution 5.1 Cancer 5.2 Neurological disease 5.3 Mental diseases 5.4 Violence and crime 6. High Risk Groups 6.1 The foetus 6.2 The breast-fed infant 6.3 Children 6.4 The chemically sensitive 7. Past Mistakes and the Precautionary Principle 7.1 The Precautionary Principle 7.2 Learning from past mistakes 8. Alternative Waste Technologies 8.1 Re-cycling, Re-use and Composting 8.2 Producing Less Waste 8.3 Zero Waste 8.4 The Problem of Plastics 8.5 Anaerobic Digestion of Organic Matter 8.6 Mechanical Biological Treatment (MBT) 8.7 Advanced Thermal Technologies (ATT) and Plasma Gasification 8.8 Greenhouse Gases 9. The Costs of Incineration 9.1 The Costs of Incineration 9.2 Health Costs of Incineration 9.3 Financial Gains from Reducing Pollution 9.4 Other Studies of the Health Costs of Pollution 10. Other Considerations of Importance 10.1 The Problem of Ash 10.2 Incinerators and Radioactivity 10.3 Spread of Pollutants 10.4 Cement Kilns 2 Monitoring 3 Risk Assessment 4 Public Rights and International Treaties 5 Conclusions 6 Recommendations References
Executive Summary Large studies have shown higher rates of adult and childhood cancer and also birth defects around municipal waste incinerators: the results are consistent with the associations being causal. A number of smaller epidemiological studies support this interpretation and suggest that the range of illnesses produced by incinerators may be much wider. Incinerator emissions are a major source of fine particulates, of toxic metals and of more than 200 organic chemicals, including known carcinogens, mutagens, and hormone disrupters. Emissions also contain other unidentified compounds whose potential for harm is as yet unknown, as was once the case with dioxins. Since the nature of waste is continually changing, so is the chemical nature of the incinerator emissions and therefore the potential for adverse health effects. Present safety measures are designed to avoid acute toxic effects in the immediate neighbourhood, but ignore the fact that many of the pollutants bioaccumulate, enter the food chain and can cause chronic illnesses over time and over a much wider geographical area. No official attempts have been made to assess the effects of emissions on long-term health. Incinerators produce bottom and fly ash which amount to 30-50% by volume of the original waste (if compacted), and require transportation to landfill sites. Abatement equipment in modern incinerators merely transfers the toxic load, notably that of dioxins and heavy metals, from airborne emissions to the fly ash. This fly ash is light, readily windborne and mostly of low particle size. It represents a considerable and poorly understood health hazard. Two large cohort studies in America have shown that fine (PM2.5) particulate air pollution causes increases in all-cause mortality, cardiovascular mortality and mortality from lung cancer, after adjustment for other factors. A more recent, well-designed study of morbidity and mortality in postmenopausal women has confirmed this, showing a 76% increase in cardiovascular and 83% increase in cerebrovascular mortality in women exposed to higher levels of fine particulates. These fine particulates are primarily produced by combustion processes and are emitted in large quantities by incinerators. Higher levels of fine particulates have been associated with an increased prevalence of asthma and COPD. Fine particulates formed in incinerators in the presence of toxic metals and organic toxins (including those known to be carcinogens), adsorb these pollutants and carry them into the blood stream and into the cells of the body. Toxic metals accumulate in the body and have been implicated in a range of emotional and behavioural problems in children including autism, dyslexia, attention deficit and hyperactivity disorder (ADHD), learning difficulties, and delinquency, and in problems in adults including violence, dementia, depression and Parkinson��s disease. Increased rates of autism and learning disabilities have been noted to occur around sites that release mercury into the environment. Toxic metals are universally present in incinerator emissions and present in high concentrations in the fly ash. • Susceptibility to chemical pollutants varies, depending on genetic and acquired factors, with the maximum impact being on the foetus. Acute exposure can lead to sensitisation of some individuals, leaving them with life-long low dose chemical sensitivity. Few chemical combinations have been tested for toxicity, even though synergistic effects have been demonstrated in the majority of cases when this testing has been done. This synergy could greatly increase the toxicity of the pollutants emitted, but this danger has not been assessed. Both cancer and asthma have increased relentlessly along with industrialisation, and cancer rates have been shown to correlate geographically with both toxic waste treatment facilities and the presence of chemical industries, pointing to an urgent need to reduce our exposure. In the UK, some incinerators burn radioactive material producing radioactive particulates. Inhalation allows entry into the body of this radioactive material which can subsequently emit alpha or beta radiation. These types of radiation have low danger outside the body but are highly destructive within. No studies have been done to assess the danger to health of these radioactive emissions. Some chemical pollutants such as polyaromatic hydrocarbons (PAHs) and heavy metals are known to cause genetic changes. This represents not only a risk to present generations but to future generations. Monitoring of incinerators has been unsatisfactory in the lack of rigor, the infrequency of monitoring, the small number of compounds measured, the levels deemed acceptable, and the absence of biological monitoring. Approval of new installations has depended on modelling data, supposed to be scientific measures of safety, even though the method used has no more than a 30% accuracy of predicting pollutants levels correctly and ignores the important problems of secondary particulates and chemical interactions. It has been claimed that modern abatement procedures render the emissions from incinerators safe, but this is impossible to establish and would apply only to emissions generated under standard operating conditions. Of much more concern are non-standard operating conditions including start-up and shut-down when large volumes of pollutants are released within a short period of time. Two of the most hazardous emissions �C fine particulates and heavy metals �C are relatively resistant to removal. The safety of new incinerator installations cannot be established in advance and, although rigorous independent health monitoring might give rise to suspicions of adverse effects on the foetus and infant within a few years, this type of monitoring has not been put in place, and in the short term would not reach statistical significance for individual installations. Other effects, such as adult cancers, could be delayed for at least ten to twenty years. It would therefore be appropriate to apply the precautionary principle here. There are now alternative methods of dealing with waste which would avoid the main health hazards of incineration, would produce more energy and would be far cheaper in real terms, if the health costs were taken into account. • Incinerators presently contravene basic human rights as stated by the United Nations Commission on Human Rights, in particular the Right to Life under the European Human Rights Convention, but also the Stockholm Convention and the Environmental Protection Act of 1990. The foetus, infant and child are most at risk from incinerator emissions: their rights are therefore being ignored and violated, which is not in keeping with the concept of a just society. Nor is the present policy of locating incinerators in deprived areas where their health effects will be maximal: this needs urgent review. Reviewing the literature for the second edition has confirmed our earlier conclusions. Recent research, including that relating to fine and ultrafine particulates, the costs of incineration, together with research investigating non-standard emissions from incinerators, has demonstrated that the hazards of incineration are greater than previously realised. The accumulated evidence on the health risks of incinerators is simply too strong to ignore and their use cannot be justified now that better, cheaper and far less hazardous methods of waste disposal have become available. We therefore conclude that no more incinerators should be approved.
1. Introduction Both the amount of waste and its potential toxicity are increasing. Available landfill sites are being used up and incineration is being seen increasingly as a solution to the waste problem. This report examines the literature concerning the health effects of incinerators. Incinerators produce pollution in two ways. Firstly, they discharge hundreds of pollutants into the atmosphere. Although some attention has been paid to the concentrations of the major chemicals emitted in an effort to avoid acute local toxic effects, this is only part of the problem. Many of these chemicals are both toxic and bio-accumulative, building up over time in the body in an insidious fashion with the risk of chronic effects at much lower exposures. Little is known about the risks of many of these pollutants, particularly when combined. In addition, incinerators convert some of the waste into ash and some of this ash will contain high concentrations of toxic substances such as dioxins and heavy metals, creating a major pollution problem for future generations. Pollutants from landfill have already been shown to seep down and pollute water sources. It is also important to note that incineration does not solve the landfill problem because of the large volumes of the ash that are produced. There have been relatively few studies of populations exposed to incinerator emissions or of occupational exposure to incinerators (see section 4), but most show higher-than-expected levels of cancer and birth defects in the local population and increased ischaemic heart disease has been reported in incinerator workers. These findings are disturbing but, taken alone, they might only serve to alert the scientific community to possible dangers but for two facts. The first is the acknowledged difficulty of establishing beyond question the chronic effects associated with any sort of environmental exposure. The second is the volume of evidence linking health effects with exposure to the individual combustion products known to be discharged by incinerators and other combustion processes. The purpose of this report is to look at all the evidence and come to a balanced view about the future dangers that would be associated with the next generation of waste incinerators. There are good reasons for undertaking this review. The history of science shows that it often takes decades to identify the health effects of toxic exposures but, with hindsight, early warning signs were often present which had gone unheeded. It is rare for the effects of environmental exposures to have been anticipated in advance. For instance it was not anticipated that the older generation of incinerators in the UK would prove to be a major source of contamination of the food supply with dioxins. In assessing the evidence we shall also look at data from a number of other areas which we believe to be relevant, including research on the increased vulnerability of the foetus to toxic exposures, and the risk of synergistic effects between chemicals, the higher risks to people more sensitive to chemical pollution, the difficulties of hazard assessment, the problems of monitoring and the health costs of incineration. 2. Emissions from Incinerators and other Combustion Sources The exact composition of emissions from incinerators will vary with what waste is being burnt at any given time, the efficiency of the installation and the pollution control measures in place. A municipal waste incinerator will take in a great variety of waste contaminated by heavy metals and by man-made organic chemicals. During incineration more toxic forms of some of these substances can be created. The three most important constituents of the emissions, in terms of health effects, are particulates, heavy metals and combustion products of man-made chemicals; the latter two can be adsorbed onto the smaller particulates making them especially hazardous. The wide range of chemicals known to be products of combustion include sulphur dioxide, oxides of nitrogen, over a hundred volatile organic compounds (VOCs), dioxins, polyaromatic hydrocarbons (PAHs), polychlorinated biphenyls (PCBs) and furans. 2.1 Particulates Particulates are tiny particles in the air that are classified by size. PM10s have a diameter of less than 10 microns whereas fine particulates (PM2.5s) are less than 2.5 microns and ultrafine particulates (PM0.1s) are less than 0.1 micron. Incinerators produce huge quantities of fine and ultrafine particulates. Incinerators are permitted to emit particulates at a rate of 10mg per cubic metre of gaseous discharge. The commonly-used baghouse filters act like a sieve, effectively allowing the smallest particulates to get through and blocking the less dangerous, larger particulates. Only 5-30% of the PM2..5s will be removed by these filters and virtually none of the PM0.1s. In fact the majority of particles emitted by incinerators are the most dangerous ultrafine particulates1. The baghouse filters are least effective at removing the smallest particles, especially those of 0.2 to 0.3 microns, and these will have a considerable health impact. Health effects are determined by the number and size of particles and not the weight. Measurements of the particle size distribution by weight will give a false impression of safety due to the higher weight of the larger particulates. Pollution abatement equipment, installed to reduce emissions of nitrogen oxides, may actually increase emissions of the PM2.5 particulates2. The ammonia used in this process reacts with sulphurous acid formed when steam and sulphur dioxide combine as they travel up the stack, leading to the production of secondary particulates. These secondary particulates are formed beyond the filters and emitted unabated: they can easily double the total volume of particulates emitted3. Present modelling methods do not take secondary particulates into account (see section 12). Studies have shown that toxic metals accumulate on the smallest particulates3 and that 95% of polycyclic aromatic hydrocarbons (PAHs) are associated with fine particulates (PM3 and below) 5-7. PAHs are toxic and carcinogenic, and it has been estimated that these increase the lung cancer risk by 7.8 times8. 2.2 Heavy Metals Incinerators are allowed to emit 10mg per cubic metre of particulates and 1mg per cubic metre of metals. The limits mean little as, even within these limits, the total amount of particulates and metals emitted will vary with the volume per second of emissions generated by the incinerator and this can vary hugely. A further concern is that there are no statutory ambient air quality standards for heavy metals apart from lead, which means the levels of heavy metals in the surrounding air do not need to be monitored. The proportion of metals to particulates allowed to be emitted by incinerators is very high and much higher than found in emissions from cars. At the high temperatures found in incinerators metals are released from metallic waste, plastics and many other substances. Many of the heavy metals emitted, such as cadmium, are toxic at very low concentrations. The selective attachment of heavy metals to the smallest particulates emitted from incinerators4 increases the toxicity of these particulates. This fact is likely to make the particulates from incinerators more dangerous than particulates from other sources such as from cars. 2.3 Nitrogen Oxides Removal of nitric oxide by incinerators is only about 60% effective and the nitric oxide is then converted to nitrogen dioxide to form smog and acid rain. Sunlight acts on nitrous oxides and volatile organic compounds (VOCs) to produce another pollutant, ozone. 2.4 Organic Pollutants A wide range of organic pollutants are emitted from incinerators. These include PAHs (polycyclic aromatic hydrocarbons), PCBs (polychlorinated biphenyls), dioxins, furans, phthalates, ketones, aldehydes, organic acids and alkenes. The waste being burnt now differs considerably from that burnt in the past with a higher load of heavy metals and plastics producing far greater potential for health and environmental problems. An example of this is PVC which is more than 90% organic chlorine. It has been used extensively for doors and windows and with an expected life of 40 years it is likely to appear in increasing quantities in the waste stream. This could easily raise the organic chlorine in the waste stream to over 1%, which according to the European Waste Directive would mean the waste would be regarded as hazardous. Many of the compounds are known to be not only toxic but bio-accumulative and persistent. They include compounds that have been reported to affect the immune system9, attach to chromosomes10, disrupt hormone regulation11, trigger cancer12, alter behaviour13, and lower intelligence14. The very limited toxicity data on many of these substances is a matter of concern15. The changing nature of waste means new substances are likely to be emitted and created. For example polybrominated diphenyl ethers (PBDEs) are found in many electrical goods and are increasingly finding their way into incinerator waste. They have been found to affect brain development and affect the thyroid gland and cause behavioural and learning defects in animals16,17. 3. Health Effects of Pollutants 3.1 Particulates A large and growing body of literature has highlighted the dangers of particulates to health. Various studies have confirmed that the smaller the size of the particles the more dangerous the health effects18-21. The data from the World Health Organisation shown in the graph below clearly illustrates that PM2.5 particles have a greater effect on daily mortality than the larger PM10s18 .
Figure 1. Increase in daily mortality as a function of PM concentration. (reproduced from ref 18, Figure 3.6) The smaller particles are not filtered out by the nose and bronchioles and their miniscule size allows them to be breathed deeply into the lungs and to be absorbed directly into the blood stream where they can persist for hours22. They can then travel through the cell walls and into the cell nucleus affecting the cell��s DNA. The WHO state that there is no safe level of PM2.5 18and health effects have been observed at surprisingly low concentrations with no threshold23,24. The smallest particulates, particularly the ultrafine particulates (PM0.1) are highly chemically reactive, a property of their small size and large surface area25. A further danger of the smallest particulates is that there are thousands more of them per unit weight. In incinerators heavy metals, dioxins and other chemicals can adhere to their surface26 increasing their toxicity. The body does not have efficient mechanisms for clearing the deeper part of the lung as only a tiny fraction of natural particles will be as small as this. As incinerators are effectively particulate generators and produce predominately the smaller particulates that have the biggest effect on mortality it is clear that incinerators have considerable lethal potential. a) Epidemiological Studies of Particulate Pollutants Fine particulates have been associated with both respiratory and cardiovascular disease27 and with lung cancer19,28. Two large cohort studies in the USA showed increasing mortality with increasing levels of PM2.5 pollution. In the Six City Study published in 199319 , 8,111 individuals were followed for 14-16 years (1974-1991), involving a total of 111,076 person years, to examine the effect of air pollution, allowing for smoking and other individual factors. As expected, the greatest risk factor was smoking (adjusted mortality-rate ratio 1.59) but, after allowing for individual factors, mortality rates showed highly significant associations (p<0.005) with the levels of fine particles and sulphate particles in the cities, with the most polluted city giving an adjusted all-cause mortality rate of 1.26 compared to the least. This related to a PM2.5 difference of 18.6µg per cubic metre: cardiopulmonary mortality was increased by 37% and lung cancer mortality was also 37% higher. In the American Cancer Society study20, 552,138 adults (drawn from the Cancer Prevention II study) were followed from 1982 to 1989 and deaths analysed against mean concentrations of sulphate air pollution in 1980 and the median fine particulate concentration from 1979-1983, both obtained for each participant��s area of residence from Environmental Protection Agency (EPA) data. Again, the strongest correlation was between lung cancer and smoking (adjusted mortality risk ratio 9.73), but both pollution measures showed highly significant association with all-cause mortality and with cardiopulmonary mortality: sulphates were also associated with lung cancer. After adjusting for smoking and other variables, higher fine particulate pollution was associated with a 17% increase in all-cause mortality and a 31% increase in cardiopulmonary mortality for a 24.5 µg per cubic metre difference in PM2.5s. These results are highly significant and led the EPA to place regulatory limits on PM2.5s, establishing the National Ambient Air Quality Standards in 1997. These regulations were challenged by industry but ultimately upheld by the US Supreme Court29 after the data from all the studies had been subjected to intense scrutiny including an extensive independent audit and a re-analysis of the original data30. The health benefits of bringing in these new regulations have been estimated as $32 billion annually31 based on mortality and chronic and acute health effects, and a White House report from the Office of Management and Budget in September 2003 calculated the benefits in terms of reductions in hospitalizations, premature deaths and lost working days as between $120 and $193 billion over the last 10 years (see section 9.1). As this study looked at only three health indicators it is likely to underestimate the true benefits. It follows from this data that incinerators and all other major sources of PM2.5 particulates will generate substantial health costs as well as increasing mortality. b) Further Studies An analysis published in 2002 of the Cancer Prevention II study participants linked the individual factors, pollution exposures and mortality data for approximately 500,000 adults as reported in the ACS study above, bringing the follow-up to 1998 28. The report doubled the follow-up period and reported triple the number of deaths, a wider range of individual factors and more pollution data, concentrating on fine particles. Smoking remained the strongest factor associated with mortality, but fine particulate pollution remained significantly associated with all-cause, and cardiopulmonary mortality with average adjusted RRs of 1.06 and 1.09. In addition, after the longer follow-up period, fine particulates were significantly associated with lung cancer mortality with an adjusted RR of 1.14. The authors reported that exposure to a 10µg per cubic metre higher level of PM2.5s was associated with a 14% increase in lung cancer and a 9% increase in cardiopulmonary disease28 . c) Cardiovascular Disease Researchers were surprised to find that the increased cardiopulmonary mortality associated with particulate pollution was primarily due to cardiovascular disease. This was found in both the Six City and ACS studies when they were re-analysed30. When the causes of death in the Cancer Prevention II Study were looked at in more detail32 to look for clues to possible pathophysiological mechanisms, the link was strongest with ischaemic heart disease: a 10µg per cubic metre increase in PM2.5s was associated with an 18% increase in deaths from ischaemic heart disease (22% in never smokers). A more recent prospective study, the Women��s Health Initiative (WHI), followed 65,893 postmenopausal women (initially free of cardiovascular disease) over 6 years, to examine the effects of the fine particulate pollution in the neighbourhood of each participant on the first cardiovascular or cerebrovascular incident and on mortality. The results for mortality and morbidity were consistent. Each increase of 10µg per cubic metre in fine particulate pollution was associated with a 76% increase in deaths from cardiovascular disease and an 83% increase in deaths from cerebrovascular disease33. The effect was independent of other variables but obese women and those who spent more time outdoors were more vulnerable to the effect. The WHI involved a more homogeneous study population and had a number of other methodological advantages over the earlier studies, resulting in greater sensitivity, and more reliable estimates. However, part of the greater effect in this study may be due to gender: there has been some evidence in other studies that women are more susceptible to the cardiovascular effects of fine particulates than men. These results imply that the increase in fine particulate pollution associated with larger incinerators can be expected to increase mortality. It is probably safe to extrapolate from the WHI assuming that the effect on mortality in the WHI was genuine for women, and that the risk to men would be half as great. In that case, if the incinerator increased PM2.5 particulates by as little as 1µg per cubic metre, cardiovascular mortality would be increased by 5-10%, with similarly increased cerebrovascular mortality. Acute myocardial infarctions have been found to rise during episodes of high particulate pollution, doubling when levels of PM2.5s were 20-25µg per cubic metre higher34. Particulates also increased mortality from stroke35,36. One study concluded that 11% of strokes could be attributed to outdoor air pollution37. Episodes of increased particulate pollution also increased admissions with heart disease38. A recent study found that each 10µg per cubic metre rise in PM10 particulates was associated with a 70% increase in DVT risk.39 Mortality from diabetes27 and admissions for diabetic heart disease are also increased40 and these were double the non-diabetic CHD admissions, suggesting that diabetics were particularly vulnerable to the effect of particulate pollution40. Higher levels of particulates have been associated with life-threatening arrhythmias41 exercise-induced ischaemia42, excess mortality from heart failure36,43 and thrombotic disease36 . d) Effect on Children and the Foetus Particulates carry various chemicals including polycyclic aromatic hydrocarbons (PAHs) into the human body. Frederica Perera from the Columbia Center for Children��s Environmental Health has found that the foetus is 10 times more vulnerable to damage by these substances44 . She also found that PM2.5 particulates have an adverse effect on the developing foetus with significant reductions in weight, length and head circumference and reiterated the importance of reducing ambient fine particulate concentrations45. In addition further studies have shown an adverse effect on foetal development at levels currently found in cities today, such as New York46. Air pollution has been found to cause irreversible genetic mutations in mice. Researchers found, in contrast, that if mice breathed air which had been freed of particulates by filtration they developed only background levels of genetic mutations, confirming that particulates were causative47 . At the fourth Ministerial Conference of Environment and Health in June 2004, the WHO announced that between 1.8 and 6.4% of deaths in the age group from 0 to 4 could be attributed to air pollution48. e) Acute Respiratory Incidents Elevated particulate air pollution has been associated with increased hospital admissions with asthma24 and with COPD49, increases in respiratory symptoms50,51, higher incidence of asthma52, reduced immunity53,54, higher rates of ear, nose and throat infection52, loss of time from school in children through respiratory disease55,56, and declines of respiratory function57-59. A sad aside to the above is that children who did more outdoor sport had greater declines in respiratory function59. We are doing a great disservice to our children if they cannot pursue healthy activities without damaging their health. f) Mortality from Particulate Pollution Episodes of increased particulate pollution have been associated with increased cardiovascular mortality19,20,27,28,36,43,60 and increased respiratory mortality43,44. About 150 time-series studies around the world have shown transient increases in mortality with increases in particulates. Cohort studies have shown a long-term effect on mortality19,20,28 (see section 3.1a). Can we quantify this mortality? It has been estimated that the increased mortality works out as about a 0.5-1% increase in mortality for each 10µg per cubic metre rise in PM10s61 for acute exposures and a 3.5% rise for chronic exposures31. For PM2.5s the increase in mortality is much greater, especially for cardiopulmonary mortality (see Table). Table 1 Cardiopulmonary Mortality and Fine Particulate Pollution
When the data from the Six Cities Study and the ACS study were subject to audit and re-analysis (see section 3.1a) the cardiopulmonary deaths were separated into pulmonary and cardiovascular30. Unexpectedly most of the excess deaths due to particulates had been from cardiovascular causes. This was apparent in each of the analyses performed giving figures for the increase in cardiovascular mortality in the Six Cities study of between 35% and 44% for an 18.6 µg per cubic metre difference in PM2.5s and in the ACS study between 33% and 47% for a 24.5µg per cubic metre. This was much higher in each case than the increase in respiratory deaths of 7%. In the ACS data it was later found that the excess cardiovascular deaths were primarily due to an 18% increase in deaths from ischaemic heart disease for each 10µg per cubic metre rise in PM2.5s32 . The Women��s Health Initiative study has demonstrated an even stronger statistical relationship between raised levels of fine particulates and cardiovascular deaths with a 76% increase in cardiovascular mortality for each 10µg per cubic metre increase in PM2.5 particulates, and this depended not just on which city a woman lived in but in which part of that city33. This study, more than any other, demonstrates the great dangers posed by fine particulates and the highlights the urgent need to remove major sources of these pollutants. As incinerators selectively emit smaller particulates and cause a greater effect on levels of PM2.5s than PM10s, they would therefore be expected to have a significant impact on cardiopulmonary mortality, especially cardiovascular mortality. This has not so far been studied directly. g) Studies Involving Ultrafine Particles Ultrafine particles (0.1µg per cubic metre and below) are produced in great numbers by incinerators1. They have been less studied than PM2.5 and PM10 particulates but there has been enough data available for the WHO to conclude that they produce health effects immediately, after a time lag and in association with cumulative exposure. They have been found to have a more marked effect on cardiovascular mortality than fine particulates, with a time lag of 4-5 days62. Stroke mortality has been positively associated with current and previous day levels of ultrafine particulates and this has occurred in an area of low pollution suggesting there may be no threshold for this effect63. Ultrafine particulates have also been reported to be more potent than other particulates on a per mass basis in inducing oxidative stress in cells64 and they have the ability to cross the blood-brain barrier and lodge in brain tissue65 . They represent another largely unknown and unexplored danger of incineration. h) Assessment by the WHO and Other Authorities Based on the World Health Organisation Air Quality Guidelines66 we have estimated that a 1µg per cubic metre increase in PM2..5 particulates (a very conservative estimate of the level of increase that would be expected around large incinerators) would lead to a reduced life expectancy of 40 days per person over 15 years (this equals a reduction of life expectancy of 1.1 years for each 10µg per cubic metre increase in PM2.5 particulates). Although this figure appears small they note that the public health implications are large and the effect on a typical population of 250,000 surrounding an incinerator would be a loss of 27,500 years of life over a 15 year time period. This figure gives an indication of the likely loss of life from any major source of PM2.5 particulates. In addition, incinerators normally operate for much longer periods than the 15 years quoted here. Note that the estimated loss of life here is likely to be an underestimate as it is from particulates alone and not from other toxic substances. The European Respiratory Society67 has published its concern about the mismatch between European Union policy and the best scientific evidence. They state that a reduction in the yearly average PM2.5 particulates to 15µg per cubic metre * would result in life expectancy gains, at age 30, of between 1 month and 2 years. They point out that the benefits of implementing stringent air pollution legislation would outweigh the costs. These recommendations are sensible and based on sound science. A programme of building incinerators would unfortunately achieve the opposite: they would increase particulate pollution, reduce life expectancy and would be at odds with the best science. Statements by leading researchers include the following: ��the magnitude of the association between fine particles and mortality suggests that controlling fine particles would result in saving thousands of early deaths each year�� (Schwartz)61 and ��there is consistent evidence that fine particulates are associated with increased all cause, cardiac and respiratory mortality. These findings strengthen the case for controlling the levels of respiratory particulates in outdoor air�� 60. * The National Ambient Air Quality Standard for PM 2.5 particulates was introduced into the USA in 1997 with a mean annual limit of 15µg per cubic metre. This had measurable health benefits. An annual mean limit for PM 2.5 particulates is to be introduced into Scotland in 2010 and this will be 12µg per cubic metre. An annual mean target for PM 2.5 particulates is to be introduced into the UK in 2020 and this will be will be 25µg per cubic metre. Many will wonder why the difference is so vast when the science is the same. i) Summary In summary there is now robust scientific evidence on the dangers to health of fine particulates and of the substantial health costs involved. Recent studies have shown the risk to be considerably greater than previously thought. For these reasons it is impossible to justify increasing levels of these particulates still further by building incinerators or any other major source of PM2.5 particulates. The data makes it quite clear that attempts should be made to the reduce levels of these particulates whenever possible. However particulates are not the only reasons to be concerned about incinerators. There are other dangers:- 3.2 Heavy Metals Pope reported that hospital admissions of children with respiratory disease fell dramatically in the Utah valley when a steel mill was closed for a year due to a strike. Air pollution analysis showed that the metal content of particulates was lower that year and that the type of inflammation found in the lungs while the steel mill was working could be reproduced in both rat and human lung tissue by using air pollutants of the type emitted by the steel mill68,69. This is a very clear illustration of the dangers of pollution of the air with heavy metals. Exposure to inhaled metals, similar to the type produced by incinerators, have been shown to mediate cardiopulmonary injury in rats70 and small amounts of metal (<1%) in particulates are known to cause pulmonary toxicity71. Salts of heavy metals such as iron and copper act as catalysts for dioxin formation causing rapid rates of dioxin formation72 increasing the dangers from burning metals. Incinerator emissions to air and ash contain over 35 metals73 . Several are known or suspected carcinogens. Toxic metals accumulate in the body with increasing age74. Breathing in air containing toxic metals leads to bioaccumulation in the human body. They can remain in the body for years: cadmium has a 30 year half-life. Incineration adds to the burden of toxic metals and can lead to further damage to health. Mercury is a gas at incineration temperatures and cannot be removed by the filters. Incinerators have been a major source of mercury release into the environment. In theory mercury can be removed using activated carbon but in practice it is difficult to control and, even when effective, the mercury ends up in the fly ash to be landfilled. Mercury is one of the most dangerous heavy metals. It is neurotoxic and has been implicated in Alzheimer��s disease75-77 , learning disabilities and hyperactivity78,79. Recent studies have found a significant increase in both autism and in rates of special education students around sites where mercury is released into the environment80,81. Inhalation of heavy metals such as nickel, beryllium, chromium, cadmium and arsenic increases the risk of lung cancer12 . Cumulative exposure to cadmium has been correlated with lung cancer82 . Supportive evidence comes from Blot and Fraumeni who found an excess of lung cancer in US counties where there was smelting and refining of non-ferrous metals83. Inhaled cadmium also correlates with ischaemic heart disease84. So what are the dangers caused by toxic metals accumulating in the body? They have been implicated in a range of emotional and behavioural problems in children including autism85, dyslexia86, impulsive behaviour87 attention deficit and hyperactivity disorder (ADHD)88,89 as well as learning difficulties14,78,90-93, lowered intelligence89 and delinquency94,89, although not every study reached standard significance levels. Many of these problems were noted in the study of the population round the Sint Niklaas incinerator95 . Exposed adults have also been shown to be affected, showing higher levels of violence13,96, dementia97-103 and depression than non-exposed individuals. Heavy metal toxicity has also been implicated in Parkinson��s disease104. Heavy metals emitted from incinerators are usually monitored at 3 to 12 monthly intervals in the stack: this is clearly inadequate for substances with this degree of toxicity. 3.3 Nitrogen Oxides and Ozone Nitrogen dioxide is another pollutant produced by incinerators. It has caused a variety of effects, primarily on the lung but also on the spleen, liver and blood in animal studies. Both reversible and irreversible effects on the lung have been noted. Children between the ages of 5 and 12 years have been estimated to have a 20% increase in respiratory symptoms for each 28 µg per cubic metre increase in nitrogen dioxide. Studies in Japan showed a higher incidence of asthma with increasing NO2 levels and that it synergistically increases lung cancer mortality rates41 . It has also been reported to aid the spread of tumours105,106. Increases in NO2 have been associated with rises in admissions with COPD107, asthma in children and in heart disease in those over 6518. Other studies have shown increases in asthma admissions108 and increased mortality with rising NO2 levels109. Rising ozone levels have led to increasing hospital admissions, asthma and respiratory inflammation and have been reported to lower immunity110. Higher levels have been significantly associated with increased mortality111 and with cardiovascular disease. Both ozone and nitrogen dioxide are associated with increasing admissions with COPD107. When it comes to incinerator emissions the health effects of nitrous oxides are likely to compound the negative health effects of particulates 3.4 Organic Toxicants Hundreds of chemical compounds are released from incinerators. They include a host of chemicals produced from the burning of plastic and similar substances and include polycyclic aromatic hydrocarbons (PAHs), brominated flame retardants, polychlorinated biphenols (PCBs), dioxins, polychlorinated dibenzofurans (furans). These substances are lipophilic and accumulate in fatty tissue and remain active in the living organisms and the environment for many years. They have been linked with early puberty112, endometriosis113, breast cancer114,115, reduced sperm counts116 and other disorders of male reproductive tissues117, testicular cancer118 and thyroid disruption11 . It has been claimed that about 10% of man-made chemicals are carcinogenic (see section 5.1), and many are now recognised as endocrine disrupters. Most of these health effects were not anticipated and are only now being recognised. No safety data exist on many of the compounds released by incinerators. PAHs are an example of organic toxicants. Although emission levels are small these substances are toxic at parts per billion or even parts per trillion73 as opposed to parts per million for many other pollutants. They can cause cancer, immune changes, lung and liver damage, retarded cognitive and motor development, lowered birth weight and lowered growth rate73. a) Organochlorines The most detailed analysis to date on incinerator emissions has identified several hundred products of incomplete combustion (PICs) including 38 organochlorines �C but 58% of the total mass of PICs remained unidentified119. Organochlorines, which include dioxins, furans and PCBs, deserve special attention, because of their known toxicity, because they bioaccumulate, and because of the likelihood that they will increase in the waste stream. Their major precursor, PVC, presently makes up 80% of organically bound chlorine and the amount of PVC in waste is likely to increase significantly in the future120. Clearly organochlorines will be an important component of incinerator emissions. Organochlorines as a group are associated with six distinct types of health impact and these often occur at low concentrations. They are associated with 1) reproductive impairment in males and females 2) developmental damage 3) impaired cognitive ability and behaviour 4) neurological damage 5) suppressed immunity and 6) hormonal disruption and hormonal cancers. Each of these six effects has been demonstrated in three separate fields: in humans, in laboratory animals and in wildlife121. The American Pubic Health Association (APHA) concluded ��virtually all organochlorines that have been studied exhibit at least one of a range of serious toxic effects, such as endocrine disruption, developmental impairment, birth defects, reproductive dysfunction and infertility, immunosuppression and cancer, often at extremely low doses��122. Other organohalogens such as bromides and fluorides have many similar properties. A common misconception is that these pollutants have little effect if dispersed into the environment. This is wrong for several reasons. Firstly they are persistent as there is no mechanism in the environment to break them down and so they accumulate. Secondly as they are fat soluble they concentrate in living matter, often dramatically, at progressively higher concentrations (bioaccumulation). For example dioxin has been found in fish at levels 159,000 times that found in the water123; PCBs have been found in North Pacific Dolphins at 13 million times the concentration in the water124 and trichloroacetic acid is found in North European conifers at 3-10,000 times that in the ambient air125. Thirdly they are concentrated by the foetus so a typical polar bear cub has a body burden double that of its mother126 and at a level known to cause reproductive failure, altered brain development and immune suppression127. Fourthly they are nearly all toxic. In short the ability of ecosystems to assimilate organochlorines and other persistent bioaccumulative compounds is close to zero and they should simply never be released into the environment. b) Dioxins Dioxins are the organochlorines compounds most associated with incinerators and inventories have consistently shown that incinerators are the major source of emissions of dioxins into the air128-30 though these are decreasing*. Dioxin releases over the last few decades have caused widespread contamination of food, significant toxic body burdens in nearly all human beings and severe pollution of the Arctic. None of this was foreseen. The damage already done by incinerators has been incalculable. Eighteen separate assessments of dioxin��s carcinogenicity have involved five different routes of exposure, five different species, low and high doses and long or short exposure times. In every case dioxins have caused cancer, involving nine different types of cancer, including lymphomas, cancers of the lung, liver, skin, soft tissue and of the oral and nasal cavities131. The National Institute of Environmental Health have looked for, but been unable to find, any threshold for the toxicity of dioxin. At the lowest detectable concentrations it can induce target genes and activate a cascade of intracellular molecular effects and can promote pre-malignant liver tumours and disrupt hormones132. Even doses as low as 2.5 parts per quadrillion can stop cultured cells from showing changes characteristic of immune responses133 . The US Environmental Protection Agency��s current estimate of dioxin��s carcinogenicity, derived from animal studies, is that the average person��s exposure to dioxin, which is 3-6 picogram per kilogram per day** gives a lifetime cancer risk of between 500 and 1000 per million134. (An acceptable cancer risk is considered to be between 1 in a million and 1 in 100,000). In comparison, a German study135, derived from human dioxin exposure, found that each additional unit dose of dioxin (one picogram per kilogram of body weight per day) is associated with an increase in lifetime cancer risk of between 1000 and 10,000 per million. The average infant receives doses of dioxins of 60-80 picograms (TEQ) per kilogram per day136,137 which is 10-20 times higher than those of the average adult and exceeds by a factor of 6 �C 10,000 every government in the world��s acceptable daily intake.*** This dioxin intake in the first year has been calculated to pose a cancer risk to the average infant of 187 per million (187 times the acceptable level)138 . All these figures demonstrate that dioxins already in the environment are at unacceptable levels and are likely to be causing up to 6% of all cancers and to be having a range of adverse impacts on health including subtle effects. Rats given dioxin to produce a body burden of dioxin at about half the average in the human population had male offspring whose sperm count was reduced by 25%139 and rhesus monkeys given dioxin equivalent to twice the average human body burden had increased foetal death in their offspring and cognitive impairment which was transgenerational (passed on to their offspring) and abnormally aggressive behaviour140,141. This data indicates that releasing even a small amount of dioxin into an already overloaded environment can simply not be justified. *An assessment of dioxins by the European Dioxin Inventory in 2005 found that in the UK, the biggest single source of dioxins in 2000 and in 2005 (projected figure) was the incineration of municipal waste, producing 20 times as much dioxin as road transport142. ** a picogram is 1,000,000,000,000 gram, ie. a billionth of a gram in the UK, but more typically described in US literature as a trillionth of a gram. *** Tolerable daily intake (TDI) is set at 0.006 picograms/kg per day in the US and 2 picograms/kg per day in the UK. 3.5 Effects on Genetic Material Both heavy metals and many chemicals form covalent bonds with DNA called DNA adducts. This can increase the risk of cancer by activating oncogenes and blocking anti-tumour genes. This raises a very serious concern. This concern is that by releasing chemicals into the environment we may not only be poisoning this generation but the next. Carcinogenesis from chemicals being passed on through several generations is not just a horrifying scenario but has been demonstrated to occur in animals143,144. Incinerator emissions would greatly increase this risk. DNA adducts to PAHs increase with exposure to pollution and patients with lung cancer have higher levels of adducts (see below). This is one demonstration of how pollutants alter genes and predispose to cancer. Other chemicals, such as vinyl chloride interfere with DNA repair and yet others such as organochlorines are tumour promoters. 3.6 Effects on the Immune System Starting in the late 1980s a series of dramatic marine epidemics killed off thousands of dolphins, seals and porpoises. Many were found to have been affected by a distemper-like virus. Autopsies of the dead animals showed weakened immune systems and high levels of pollutants including PCBs and synthetic chemicals. A virologist, Albert Osterhaus and his co-workers, demonstrated that when seals were fed contaminated fish containing organochlorines (which were, however, considered fit for human consumption) they developed immune suppression and were unable to fight viruses145-7. Their natural killer cells were 20-50% below normal and their T cell response dropped by 25-60%. The immune suppression was due to dioxin-like chemicals, PCBs and synthetic chemicals. An immunologist Garet Lahvis found immunity in dolphins in the USA dropped as PCBs and DDT increased in their blood148. The immune system appeared most vulnerable during prenatal development. This demonstrates that the immune system may be damaged by exposure to synthetic chemicals and that we have seriously underestimated the dangers of these chemicals. Animal experiments have shown immunotoxicity with heavy metals, organochlorine pesticides and halogenated aromatics149 and accidental exposure data on humans has shown immunotoxicity with PBBs, dioxins and aldicarb. In fact whole volumes have been written on immunotoxicity150. Note these are the type of pollutants released by incinerators. Environmental toxins have been shown to decrease T-lymphocyte helper-suppressor ratios in four different exposed populations151. Nitrogen dioxide exposure leads to abnormally elevated immune and allergic responses. PM2.5 particulates themselves can cause mutagenic and cytotoxic effects and the smallest particulates cause the greatest effects152. In utero exposure to dioxins results in thymus atrophy and weakened immune defences153. When female rhesus monkeys were exposed to PCBs at very low levels producing a body burden typical of general human population, their offspring��s ability to mount a defence against foreign proteins was permanently compromised154. In summary there is abundant evidence that a large number of the pollutants emitted by incinerators can cause damage to the immune system155 . As is demonstrated in the next section the combination of these is likely to have an even more potent and damaging effect on immunity than any one pollutant in isolation. 3.7 Synergistic Effects Various studies have shown that a combination of substances can cause toxicity even when the individual chemicals are at a level normally considered safe. The report ��Man��s Impact on the Global Environment�� by the Massachusetts Institute of Technology stated ��synergistic effects among chemical pollutants are more often present than not��156. Testing has been minimal and most of the synergistic effects are likely to remain unknown. Toxicologist Prof Vyvyan Howard has calculated that to test just the commonest 1,000 toxic chemicals in unique combinations of three would require 166 million different experiments and even this would disregard varying doses157 . Synergy has been demonstrated when organic chemicals are combined with heavy metals,158,159 and with combinations of pesticides160,161 and food additives162. The last study is of particular concern. Rats fed with one additive were unharmed. Those fed two developed a variety of symptoms whereas those fed all three all died within two weeks. In this case the chemicals appeared to amplify each other��s toxicity in logarithmic fashion. In a recent experiment scientists dosed animals with a mixture of 16 organochlorine pesticides, lead and cadmium at ��safe levels�� and found they developed impaired immune responses, altered thyroid function and altered brain development163. Another study in 1996, published in Science, reported on the dangers of combinations of pesticides and their ability to mimic oestrogen. They found that combinations could increase the toxicity by 500 to 1000 times164. Mice exposed to 25 common groundwater pollutants, all at levels well below those that produce any effects in isolation, developed severe immunosuppression165. The level of concern about the multiplicity of pollutants released into the air by incinerators is enhanced by the fact that even when the probable effects of the single pollutants involved are known, no one has any idea what damage the combinations can cause. The population living round an incinerator is being exposed to multiple chemical carcinogens, and to fine particulates, to carcinogenic heavy metals (in particular cadmium) and in some cases to radioactive particles, all known to increase lung cancer. Nitrogen dioxide has also been shown to synergistically increase lung cancer. When all these are combined, the effects are likely to be more potent, and, in fact, an increase in the incidence of lung cancer has been reported around incinerators (see section 4.1). The potential for multiple pollutants to cause other serious health effects is illustrated by the results of a key study on rats exposed to the dust, soil and air from a landfill site. These animals developed abnormal changes in the liver, thyroid and reproductive organs within only two days of exposure166. Although effects in animals do not always mimic those in humans, the authors concluded that present methods of calculating health risks underestimate the biological effects. This has obvious relevance to the dangers of exposing people to multiple pollutants from incinerators. 4. Increased Morbidity and Mortality near Incinerators 4.1 Cancer There have been a number of studies of the effect of incinerators on the health of the surrounding population, mainly concentrating on cancer incidence. In most studies, the incinerators were situated near other sources of pollution and often in areas of deprivation, both likely to confound the findings since both are associated with higher cancer incidence. The study of an incinerator burning 55,000 tonnes of waste a year and built in 1977 in the middle of a residential area of a town of 140,000 with no heavy industry (Sint Niklaas) is scientifically unsatisfactory because funds were not made available for the study of controls95 . However, the investigators mapped a convincing cluster of 38 cancer deaths immediately surrounding and to leeward of the incinerator, and this area also showed high concentrations of dioxin in soil samples when tested in 1992. They noted that the cancer SMR for this town for 1994-1996 (national statistics) was high (112.08 for males and 105.32 for females), supporting the genuine nature of their findings. In 1996, Elliott et al. published a major study167 in which they compared the numbers of registered cancer cases within 3 km and within 7.5 km of the 72 municipal waste incinerator sites in the UK with the number of cases expected. It involved data on over 14 million people for up to 13 years. Expected numbers were calculated from national registrations, adjusted for unemployment, overcrowding and social class. No account was taken of prevailing winds, or of differences between incinerators. They first studied a sample of 20 of the incinerator sites, replicating the analysis later with the other 52. If the results of two sets like this concur, it strengthens the data. In each set there was an excess of all cancers near the incinerators, and excesses separately of stomach, colorectal, liver and lung cancers, but not leukaemias. The first set gave adjusted mortality ratios for all cancers of 1.08 for within 3km and 1.05 within 7.5 km; for the second these were 1.04 and 1.02. These risks, representing an additional risk of 8% and 5% for the first set and 4% and 2% for the second, seem small but represented a total of over 11,000 extra cancer deaths near incinerators and were highly significant (p <0.001 for each). For each of the main cancer sites the excesses were higher for those living within 3 km than for all within 7.5 km167,168, suggesting that the incinerators had caused the excess. The authors doubted this and attributed the findings to additional confounding in spite of the fact that they had already adjusted (possibly over-adjusted) for unemployment, overcrowding and social class, which give a partial correction for pollution. Moreover, the effect on people living to leeward of the incinerator would be substantially higher than shown by this study as the true number of people affected was diluted by those living at the same distance but away from the wind plume coming from the incinerator. Knox et al. looked at the data from 22,458 children who died of cancer between 1953 and 1980 in the UK169. For each child they compared the distance of the birth and death addresses from the nearest source of pollution and found a consistent asymmetry: more had moved away from the nearest hazard than towards it169. They deduced that the excess of migrations away from the hazard (after allowing for social factors) was evidence that the children had been affected by the cancer-causing pollution before or shortly after birth. Later they applied the method to the set of incinerators studied by Elliott et al. and again showed the same asymmetry in the children��s birth and death addresses, indicating that the incinerators had posed a cancer risk to children170. Of the 9,224 children for whom they had found accurate birth and death addresses, 4,385 children had moved at least 0.1 km. Significantly, more children had migrated away from incinerators than towards. For all those who had at least one address within 3 km of an incinerator, the ratio was 1.27. When they limited the analysis to children with one address inside a 5 km radius from the nearest incinerator and the other address outside this radius the ratio was 2.01; this indicated a doubling of cancer risk. Both these findings were highly significant (p <0.001 for each). The excess had only occurred during the operational period of each incinerator and was also noted round hospital incinerators but not landfill sites. This is strong evidence that the incinerators�� emissions contributed to the children��s cancer deaths. Biggeri et al. in 1996 compared 755 lung cancer deaths in Trieste with controls in relation to smoking, probable occupational exposure to carcinogens and air pollution (measured nearest to their homes) and the distance of their home from each of four pollution sites. The city centre carried a risk of lung cancer but the strongest correlation was with the incinerator where they found a 6.7 excess of lung cancer after allowing for individual risk factors171. Using a spatial scan statistic, Viel et al 2000 looked at the incidence of soft tissue sarcoma and non-Hodgkin��s lymphoma from French Cancer Registry data, in two areas close to an incinerator with high emission of dioxin172. They found highly significant clusters of soft tissue sarcoma (RR 1.44) and of non-Hodgkins lymphoma (RR 1.27) but no clusters of Hodgkins disease (used as negative control). This study was interesting in that it was designed to look both in a focussed way at the area round the incinerator, and to check the association by looking for space time relationships which should be present if the relationship was causal. In addition they looked in an unfocussed way for other clusters in the wider area which contained other areas of deprivation. Both the first two analyses were positive close to the incinerator -demonstrating that a causal relationship was likely -and since no other clusters were found they concluded that deprivation could be virtually excluded as a factor. According to Ohta et al, Japan built 73% of all the municipal waste incinerators in the world and by 1997 had become very concerned about their health effects: in the village of Shintone, 42% of all deaths between 1985-95 in the area up to 1.2 km to leeward of an incinerator (built in 1971) were due to cancer, compared to 20% further away and 25% overall in the local prefecture173 . Their data on soil contamination reinforced the importance of considering wind directions in evaluating the health effects of incinerators. Comba found an increased incidence of soft tissue sarcoma in an Italian population living within 2 km of an incinerator174. Zambon et al looked at cases of sarcoma from a different perspective. They calculated dioxin exposure from incinerators and other industrial sources in patients with sarcoma using a dispersion model and found the risk of sarcoma increased with the extent and duration of exposure to dioxin175. In 1989 Gustavsson reported a twofold increase in lung cancer in incinerator workers in Sweden compared to the expected local rate176. In 1993 he reported a 1.5 fold increase in oesophageal cancer in combustion workers, including those working in incinerators177. 4.2 Birth Defects There have been five reports of increases in congenital abnormalities around incinerators. The investigators at Sint Niklaas noted multiple birth defects to leeward of the incinerator95. Orofacial defects and other midline defects were found to be more than doubled near an incinerator in Zeeburg, Amsterdam178. Most of these deformed babies were born in an area corresponding to wind-flow from the incinerator and other defects included hypospadius and spina bifida. In the Neerland area, Belgium, there was a 26% increase in congenital anomalies in an area situated between two incinerators179. A study of incinerators in France has shown chromosomal defects and other major anomalies (facial clefts, megacolon, renal dysplasias)180. A recent British study looked at births in Cumbria between 1956 and 1993 and reported significantly increased lethal birth defects around incinerators after adjusting for year of birth, social class, birth order, and multiple births. The odds ratio for spina bifida was 1.17 and that for heart defects 1.12. There was also an increased risk of stillbirth and anencephalus around crematoriums181. The study pointed out that the figures for birth defects are likely to be substantial underestimates since they do not include spontaneous or therapeutic abortions, both increased by foetal anomalies. In addition, several studies have noted an increase in birth defects near waste sites, particularly hazardous waste sites. The pattern of abnormalities was similar to the pattern found with incinerators, with neural tube defects often being the most frequent abnormality found, with cardiac defects second182-85. Harmful chemicals are normally stored in fatty tissue: in the foetus there is little or no fatty tissue except for that in the brain and nervous system, which may explain the pattern of damage. A review of this subject stated ��the weight of evidence points to an association between residential proximity to hazardous waste site and adverse reproductive outcomes.��186 4.3 Ischaemic Heart Disease Gustavsson found an excess of ischaemic heart disease176 in incinerator workers who had been exposed for longer. We have not found any epidemiological studies of cardiovascular disease in the neighbourhood of incinerators, but in view of the research on particulates (see section 3.1) this should be investigated. 4.4 Comment The authors of some of these reports did not consider that they had sufficient grounds for concluding that the health effects round incinerators were caused by pollution from the incinerators. However, statistically their findings were highly significant and, taking the studies together, it is difficult to believe that all their results could have been due to unrecognised confounding variables. This is even less likely when you consider the nature of the pollutants released from incinerators and the scientific evidence for the health effects of those compounds (see sections 2 and 3). The concordance of increased cancer incidence in local areas demonstrated to be more polluted also points to a causal association, although it does not necessarily imply that the pollutant measured contributed to the increase. The studies may have underestimated the risks. At 13 years, the follow-up period of the large British study was probably too short: at Sint Niklaas adult cancer cases seemed to increase from 13 years onward (although children��s cancers occurred earlier), and in Japan, Ohta noted that cancer caused 42% of all deaths in the lee of incinerators from 14 to 24 years after the incinerator was commissioned173 . The reported risks were higher in the studies in which allowance was made for the direction of prevailing winds, possibly because of dilution elsewhere by relatively unexposed persons. The studies reviewed apply to the older incinerators: newer incinerators may have better filters but fine particulates and metals are incompletely removed. Since some of these pollutants, notably fine particulates, do not appear to have a safe threshold, it is clearly incorrect to claim that incinerators are safe. The higher quantity of toxic fly ash produced by modern incinerators, which is easily wind-borne, represents an additional hazard. Even if incinerators were equipped with perfect filters, their huge size and tendency to faults means that the risk of intermittent high levels of pollution is a real concern. Taking into account these results and the difficulty in identifying causes of cancers and other chronic diseases, it is a matter of considerable concern that incinerators have been introduced without a comprehensive system to study their health effects, and that further incinerators are being planned without comprehensive monitoring either of emissions or of the health of the local population. 5. Disease Incidence and Pollution 5.1 Cancer Studies linking cancer with incinerators cannot be seen in isolation. It is important to obtain an overall picture and look at other studies which link pollutants with cancer. And there is another aspect to this. Many types of cancer, including lung, pancreatic and stomach cancer, have a very poor prognosis and our only hope lies in prevention. Prevention means reducing our exposure to carcinogenic substances and we should take every opportunity to do this. Cancer has shown an unrelenting rise over the last century, and is affecting younger people. The rise has been gradual, steady and real. Cancer incidence has been increasing by 1% per annum with an age standardized increase in mortality of 43% between 1950 and 1988187. Put another way, the chance of dying from cancer at the turn of the 20th century was 1 in 33. It is now 1 in 4. WHO data has demonstrated that 80% of cancers are due to environmental influences,188 and evidence from migrant studies confirms that it is mainly the environment rather than the genes that determine the cancer risk188 . Many people have noted that the rise in cancer has paralleled the rise in the production and use of synthetic chemicals, all the more remarkable since there has been a simultaneous large drop in smoking in males in many countries. In the second half of the twentieth century synthetic chemical production doubled every 7 to 8 years with a 100 fold increase over the last 2 generations189. Many converging pieces of evidence link chemicals to the relentless rise of cancer. a) Links between exposure to pollutants and cancer in man Cancer is commonest in industrialised countries with 50% of cases in the industrialised 20% of the world190 and the WHO has noted that cancer incidence rises with the GNP of a country. There is the same correlation within countries. The highest mortality from cancer in the USA is in areas of highest industrialised activity. There is also a correlation in the USA between cancer incidence and the number of waste sites in the county191,192. Counties with facilities for treating toxic waste have four times as much breast cancer193. Cancer is also commoner in counties with chemical industries194. Public Data Access in the USA shows a close correlation between cancer mortality and environmental contamination195. Numerous studies have shown higher cancer incidence in both industrial workers and in populations living in polluted areas.196,197 One of the three most rapidly rising cancers, non-Hodgkin��s lymphoma, has been clearly linked with exposure to certain chemicals (for instance phenoxyherbicides and chlorophenols).198,199
b) Links between exposure to pollutants and cancer in animals Three decades of studies of cancers in wildlife have shown that these are intimately associated with environmental contamination. This is particularly important as animals do not smoke, drink or eat junk food and cannot be accused of living in deprived areas. This strengthens the long-suspected link between environmental pollution and cancer. In a recent study of outbreaks of liver cancer in 16 different species of fish at 25 different sites, cancers were always associated with environmental contamination200. Dogs have been found to have higher rates of bladder cancer in industrialised counties in the USA201. It is inconceivable that we are not affected in the same way. Furthermore cancer rates in animals rapidly decline when the pollutants are removed showing the critical importance of an uncontaminated environment for good health.202 c) Large increases in cancer in certain tissues Steep rises in cancer have occurred in tissues directly exposed to the environment: the lung and skin. But some of the steepest rises have occurred in parts of the body with high fat content, including cancers of the brain, breast, bone marrow and liver. This again points to toxic chemicals which are predominantly stored in the fatty tissues. d) Genetic mutation Many chemicals are known to attach to DNA causing genetic change in the form of DNA adducts. The research of molecular epidemiologist, Dr Frederica Perera, of Columbia Centre for Children��s Environmental Health, has shown consistent associations between exposures to pollution and DNA adduct formation on the one hand and adduct formation and cancer risk on the other203,204. Perera found two to three times the level of DNA adducts to polycyclic aromatic hydrocarbons in people in polluted areas and also found higher levels of adducts in people with lung cancer than in those without. Mothers exposed to pollution form DNA adducts but their babies have even higher adduct levels potentially putting them at increased risk of cancer from birth44. e) Cancers and Environmental pollution Several studies have already given direct evidence of a link between environmental pollution and cancer. These include the Long Island Study showing a link between airborne carcinogens and breast cancer205,206 and the Upper Cape Study showing that tetrachloroethylene in the water was associated with elevated rates of several types of cancer207-9. It is noteworthy that initial investigations were negative in both these places and it was only demonstrated after detailed and sophisticated studies by scientists from many fields. Numerous other studies have shown links between cancer and chemicals: these include associations between volatile organic chemicals (VOCs) in the water and increases in leukaemia in New Jersey210 , increases in lymphoma in counties in Iowa where drinking water was contaminated with dieldrin211 , elevated levels of leukaemia in children at Woburn, Massachusetts coinciding with a known period of water contamination with chlorinated solvents212, a cancer cluster linked to consumption of river water contaminated by industrial and agricultural chemicals in Bynum, North Carolina213 and high rates of non-Hodgkin��s lymphoma from water contamination with chlorophenols in Finland214 . f) Spread of cancer and pollutants Airborne pollutants not only affect the chance of contracting cancer but may also influence the chance of the cancer spreading. Animal studies showed that inhalation of ambient level nitrogen dioxide, or polluted urban ambient air, facilitated blood-borne cancer cell metastasis105. g) Levels of Carcinogens in the body The reality about most chemicals is that their risks are largely unknown. This is particularly true of chemicals new to the market. What we do know is that about 5 to 10% are probable carcinogens. The International Agency for Cancer Research tested 1000 chemicals in 1993 and found that 110 were probable carcinogens215. The National Toxicity Program tested 400 chemicals in 1995 and found that 5-10% were carcinogenic216. Only 200 of the 75,000 synthetic chemicals in existence are regulated as carcinogens whereas, from this data, between 3,000 and 7,500 might be expected to be. We have even less knowledge about the carcinogenic potential of combinations of toxic chemicals but what evidence we do have suggests combinations may be more dangerous and yet these are what we are routinely exposed to. Although the UK figures are not available we know that 2.26 billion pounds of toxic chemicals were released in the USA in 1994: about 177 million pounds of these will have been suspected carcinogens. But what happens to all these chemicals? The reality is that much of this chemical pollution ends up inside us. The evidence for this is as follows: In a study, a group of middle aged Americans were found to have 177 organochlorine residues in their bodies.217,218 This is likely to be an underestimate as EPA scientists consider that the fatty tissues of the US general population contain over 700 additional contaminants that have not yet been chemically characterized219 . A recent study by the Mount Sinai School of Medicine measured chemicals in the blood and urine of healthy volunteers and found an average of 52 carcinogens, 62 chemicals toxic to the brain and nervous system and 55 chemicals associated with birth defects220. They point out that these were chemicals that could be measured and that there were many more that could not, making this again a considerable underestimate. A study of pollutants in amniotic fluid found detectable levels of PCBs and pesticides at levels equivalent to the foetus��s own sex hormones221. What these studies demonstrate is that what we put out into the world sooner or later comes back to us and will be stored in our bodies, particularly the lipophilic, bioaccumulative compounds which are particularly damaging. This effect is slow, insidious and real. To allow carcinogens and other poisonous substances into our bodies in this way must be to gamble with our health. Incinerators emit carcinogens. Particulates themselves are known to be carcinogenic, many heavy metals are known or suspected carcinogens, up to 10% of the chemical pollutants are carcinogenic and there is abundant evidence that carcinogens are far more dangerous when combined than when in isolation. Common sense dictates that it is reckless to continue to pour more carcinogens into the air at a time when cancer is steadily increasing. Recent studies suggest that we already have to cope with 65 carcinogens in food, 40 carcinogens in water and 60 carcinogens in the air we breathe222. They should not be there at all. They should certainly not be increased. If we seriously want to prevent cancer it is of paramount importance that we rapidly decrease the levels of all carcinogens that we are exposed to. 5.2 Neurological Disease Most toxic compounds are preferentially stored in fatty tissue and this includes the brain �C making the brain a key target organ for pollutants. There is now compelling evidence that heavy metals and other compounds such as PCBs and dioxins cause cognitive defects, learning problems and behavioural disturbances in children and these effects occur at levels previously thought to be safe223 . It is inconceivable that these same pollutants have no impact on adult brain function. In fact, some organochlorines, especially those with toxic metabolites and those that dissolve in the cell membranes are known to kill brain cells.224,225 We note also the ability of ultrafine particulates to carry pollutants across the blood-brain barrier65. If neurones were lost at the undetectable rate of 0.1% annually this would lead to a major decline in brain function by middle age226. Of great concern is the developing crisis of Alzheimer��s disease which now affects 4.5 million patients in the USA and nearly 700,000227 in the UK. This is a disease which had never been diagnosed until 1907 and in the UK had only reached 150 cases by 1948. At the present rate of increase, the numbers will double by 2030. These statistics are alarming but need to be seen as part of an overall trend of increasing neurological disease. A recent study has noted substantial increases in neurological diseases in the last two decades coupled with earlier onset of these illnesses. Increases were noted in Alzheimer��s disease, Parkinson��s disease and motor neurone disease228. The increase in Alzheimer��s disease was found in almost all developed countries, and rises varied across countries from 20% (which was defined as substantial) to 1200%. The paper suggested environmental factors were likely to be responsible. It is notable that these diseases of older people have increased at the same time that diseases affecting the brain (including ADHD, autism and learning difficulties) have also shown large increases at the other end of the age spectrum, to the order of 200-1700%229. It is very likely that these diseases have aetiological factors in common. Heavy metal exposure is known to correlate with both Parkinson��s disease103,230 and Alzheimer��s disease75,76,98-102. Both diseases have increased dramatically over the last 30 years. In addition we have already noted that the average person��s body contains at least 62 chemicals which are toxic to the brain and nervous system220. It is crucial to look at every possible way to prevent Alzheimer��s because of its huge care costs (US figures are $60 billion annually) and because of its dire effect on both patients and carers. Although multiple factors are probably involved in its causation, there is evidence of a link to heavy metal exposure and it is therefore imperative to reduce our exposure to these toxic metals and other neurotoxic chemicals by all means possible. To deliberately increase our exposure to these pollutants, at a time when these diseases are showing huge increases, shows a worrying lack of foresight. 5.3 Mental Diseases Many pollutants pass straight from the nose to the brain where they affect brain function. Air pollution correlates with inpatient admissions with organic brain syndrome, schizophrenia, major affective disorders, neurosis, behavioural disorder of childhood and adolescence, personality disorder and alcoholism231. Increases in the total number of psychiatric emergency room visits and in schizophrenia232 have been noted on days when air pollution has been high. Depression has also been linked to inhaled pollutants233,234. Clearly something very profound occurs when we pollute the air. 5.4 Violence and Crime An increasing number of studies, including studies of murderers235, case-control and correlation studies13,94,236,237 and prospective studies96,238 have shown links between violence and heavy metals and these include lead, cadmium and manganese. The majority of the studies have investigated lead. Violence and crime have been associated with both increased body levels of lead and with increased levels of lead in the air. For instance Denno239 found early lead exposure was one of the most important predictors of disciplinary problems from ages 13 to 14, delinquency from ages 7 to 17 and adult criminal offences, from ages 18 to 22. Stretesky found an association between air lead levels and murder rates in US counties240. It is interesting that air lead levels were a much stronger predictor of both violent and property crime than unemployment, which has often been considered an important cause for crime241. The likely mechanism is that these substances alter neurotransmitters such as dopamine and serotonin and reduce impulse control. This growing literature should serve as a warning about the dangers of allowing heavy metals to be emitted into the environment. Crime, especially violent crime, can have a dramatic effect on people��s quality of life. We need to consider the effect of incinerators, not only on health, but on education and on quality of life, including the impact of violence and crime. 6. High Risk Groups 6.1 The Foetus The unborn child is the most vulnerable member of the human population. The foetus is uniquely susceptible to toxic damage and early exposures can have life changing consequences. Why is the foetus so vulnerable? There are two main reasons. Firstly most of these chemicals are fat soluble. The foetus has virtually no protective fat stores until very late pregnancy so the chemicals are stored in the only fatty tissues it has, namely its own nervous system and particularly the brain. Secondly many pollutants are actively transported across the placenta from the mother to the foetus. This occurs with heavy metals which the body mistakes for essential minerals. This is particularly critical for mercury where one tenth of women already have body stores of mercury which can lead to neurodevelopmental problems in the newborn242. Other factors that increase foetal susceptibility are higher rates of cell proliferation, lower immunological competence and decreased capacity to detoxify carcinogens and repair DNA243. Safety limits currently do not take into account this increased risk to the foetus. Only 7% of high volume chemicals have been tested for neurodevelopmental toxicity244 and very few pollutants have been tested for teratogenicity. During a narrow window of time, in the first 12 weeks in utero, the foetus��s body is affected by miniscule amounts of hormone measured in parts per trillion. Tiny amounts of chemicals can upset this delicate balance. It is now generally accepted that chemicals that are not toxic to an adult can have devastating effects on the newborn. Porterfield has shown that small amounts of chemicals such as dioxins and PCBs, at doses that are not normally regarded as toxic, can affect thyroid hormones and neurological development11 . A single exposure is enough and timing is critical245 . Small doses of oestrogenic chemicals can alter sexual development of the brain and the endocrine system246. It is estimated that 5% of babies born in the USA have been exposed to sufficient pollutants to affect neurological development247 . It has also been shown that exposure to oestrogenic chemicals affects immunity, reduces the immune response to vaccines, and is associated with a high incidence of middle ear and recurrent respiratory infections248 . The amount of chemical that the baby takes in relates to the total persistent contaminants that have built up in the mother��s fat over her lifetime249 . This will increase in areas around incinerators. Exposure to fine particulate pollution during pregnancy can have an adverse effect on the developing foetus and lead to impaired foetal growth74 . In July 2005, in a ground-breaking study250, researchers at two major laboratories in the USA looked at the body burden in the foetus. They reported an average of 200 industrial chemicals and pollutants (out of 413 tested) in the umbilical cord blood of 10 randomly chosen babies. These included 180 carcinogens, 217 chemicals that are toxic to the brain and nervous system and 208 that can cause birth defects and abnormal development in animals. A statement by scientists and paediatricians said that the report raised issues of substantial importance to public health, showed up gaping holes in the government��s safety net and pointed to the need for major reform to the nation��s laws that aim to protect the public from chemical exposures. Two months later, scientists at the University of Groningen, released the results of a European study, commissioned by WWF and Greenpeace, on the foetal body burden. They tested for the presence of 35 chemicals in the umbilical cord blood of newborns251. At least five hazardous chemicals were found in all babies and some had as many as 14 different compounds. The report questioned the wisdom of allowing the foetus to be exposed to a complex mixture of persistent, bio-accumulative and bioactive chemicals at the most critical stage of life. Incinerators can only have the effect of increasing the foetal body burden and their use is therefore a retrograde step for society. It is particularly important to apply the precautionary principle in issues that affect the foetus, infant and child. 6.2 The Breast-fed Infant It is a major concern that breast milk, perhaps the greatest gift a mother can give for the future health of her child, has now become the most contaminated food on the planet, in terms of persistent organic pollutants252. In the USA studies of human breast milk have shown that 90% of samples contained a disturbing 350 chemicals. This was higher in industrialised areas showing that inhalation of these toxic substances is an important factor253 . The dose taken in by a breast-feeding baby is 50 times higher than that taken in by an adult254 . The incinerator would add to the total load of chemicals in the mother��s fat and those toxins accumulated over a lifetime by the mother will then be transferred to the tiny body of her baby through her milk. Six months of breast feeding will transfer 20% of the mother��s lifetime accumulation of organochlorines to the child255. From 1979 one in four samples of breast milk have been found to be over the legal limit set for PCBs in commercial feeds249 and these are known to impair intellectual development-256-8. Contamination with persistent organic pollutants (POPs) in breast milk in animals has consistently shown structural, behavioural and functional problems in their offspring259. For instance, in monkeys it has shown that it decreases their ability to learn260-2. Polybrominated diphenyl ethers (PBDEs) are toxic chemicals which have been doubling in breast milk every five years, and have also been rapidly increasing in the waste fed to incinerators as they are now present in many common electrical and electronic goods. PBDEs cause cancer, birth defects, thyroid dysfunction and immune suppression.263,264 It is truly tragic that one of the few ways of removing these contaminants from the mother��s body is by breast-feeding. 6.3 Children Toxic and carcinogenic exposures in early life, including prenatal exposures, are more likely to lead to cancer than similar exposures later265-7 . At the First International Scientific Conference of Childhood Leukaemia, held in September 2004, Professor Alan Preece suggested that pollutants crossing the placenta, were damaging the immune system and could be linked with soaring rates of leukaemia, which were being initiated in utero. This theme was expanded by Professor George Knox in his recent study which found that children born in ��pollution hotspots�� were two to four times more likely to die from childhood cancer. The ��hotspots�� included sites of industrial combustion, and sites with higher levels of particulates, VOCs, nitrogen dioxides, dioxins and benz(a)pyrenes �C in other words just what would be found around incinerators. He said that, in most cases, the mother had inhaled these toxic substances and they were then passed on to the foetus through the placenta268. This is supported by animal studies which have already confirmed that cancer in young can be initiated by giving carcinogens before conception (to the mother), in utero or directly to the neonate269,270. Developing systems are very delicate and in many instances are not able to repair damage done by environmental toxicants271. In one study there was an age-related difference in neurotoxicity for all but two of 31 substances tested; these included heavy metals, pesticides and other chemicals272 . Children are not just a vulnerable group but the current inhabitants of a developmental stage through which all future generations must pass. This fact is recognised in the passage of the Food Quality Protection Act in the USA. It requires that pesticide standards are based primarily on health considerations and that standards are set at levels which will protect the health of children and infants. Developmental disorders including autism and attention deficit syndrome are widespread and affect 3-8% of children. The US National Academy of Sciences concluded in July 2000 that 3% of all developmental disorders were a direct consequence of toxic environmental exposures and another 25% are the result of interactions between toxic exposures and individual susceptibility. The causes included lead, mercury, PCBs, certain pesticides and other environmental neurotoxicants273, substances that are all discharged from incinerators Recently associations have been reported in case control studies between the body burden of mercury and the risk of autism274. In other studies in Texas, associations have been found between the amount of mercury discharged into the air and water by chemical plants and the local incidence of autism80 and an inverse relationship between the distances of schools from the plants discharging mercury and autism in their youngest pupils 4 years later; this is the lag expected from the fact that the greatest sensitivity to neurotoxicity is seen before birth and in neonates81. This suggests that mercury could be responsible but the contribution of other neurotoxins was not excluded. The study of the Sint Niklaas incinerator found a multitude of problems in children, including learning defects, hyperactivity, autism, mental retardation and allergies95 and this is exactly what would be anticipated from the above and research already done on the health effects of heavy metals, PCBs and dioxins on children. Animal studies show similarities, with a recent study demonstrating autistic-like behavioural changes in rats whose mothers has been exposed to PCBs whilst pregnant; they had developed abnormal plasticity in the cortex of the brain275. We need also to consider subclinical toxicity. The pioneering work of Herbert Needleman showed that lead could cause decreases in intelligence and alteration of behaviour in the absence of clinically visible signs of toxicity92. This has also been shown to be the case with PCBs276 and methyl mercury79. These effects are all the more likely when children are exposed to multiple pollutants, notably the heavy metals, which will be found in the cocktail of chemicals released by incinerators. Although this has only minor implications for an individual it can have major implications for a population. For instance a 5 point drop of IQ in the population reduces by 50% the number of gifted children (IQ above 120) and increases by 50% the number with borderline IQ (below 80)277. This can have profound consequences for a society, especially if the drop in IQ is accompanied by behavioural changes. 6.4 The Chemically Sensitive In the book, Chemical Exposures, Low Levels and High Stakes by Professors Ashford and Miller151, the authors noted that a proportion of the population react to chemicals and pollutants at several orders of magnitude below that normally thought to be toxic. For example research has discovered individuals who react to levels of toxins previously considered to be safe. Two examples are benzene278 and lead93. It has been demonstrated that there is a tenfold difference between different individuals in the metabolism of the carcinogenic PAH benz(a)pyrene279 . Ashford and Miller also noted that studies in both toxicology and epidemiology have recognised that chemicals are harmful at lower and lower doses and that an increasing number of people are having problems. A significant percentage of the population have been found to react this way (15 to 30% in several surveys with 5% having daily symptoms).151 Research has shown 150 to 450 fold variability in response to airborne particles280. Friedman has stated that environmental regulation requires the protection of these sensitive individuals281. This highlights the dangers of incinerators which emit a multitude of chemical compounds. Chemical sensitivity is typically triggered by an acute exposure after which symptoms start to occur at very low levels of exposure151 . Faults are all too common with modern incinerators leading to discharges of pollutants at levels that endanger health �C giving a very real risk of long-term sensitisation. Certain susceptible individuals will be highly affected by these pollutants and these effects will be difficult to anticipate. In addition, people affected this way are extremely difficult to treat. 7. Past Mistakes and The Precautionary Principle 7.1 The Precautionary Principle The Precautionary Principle has now been introduced into national and international law including that of the European Union282. This principle involves acting in the face of uncertain knowledge about risks from environmental exposures. This means public health measures should be taken in response to limited, but plausible and credible, evidence of likely and substantial harm283. It is summed up in the 1998 Wingspread statement: ��When an activity raises threats of harm to human health or the environment, precautionary measures should be taken even if some cause and effect relationships are not fully established scientifically. In this context, the proponent of the activity, rather than the public, should bear the burden of proof.�� In the case of incinerators a recent review of health effects found two thirds of studies showed a positive exposure-disease association with cancer (mortality, incidence and prevalence)284 and some studies pointed to a positive association with congenital malformations. In addition without exact knowledge of what pollutants are produced by incinerators, their quantities, their environmental fate or their health effects, it is impossible to assure their safety. It is absolutely clear from this and from the evidence presented here that building municipal waste incinerators violates the Precautionary Principle and perhaps European Law. 7.2 Learning from Past Mistakes Time and time again it has been found that what we did not know about chemicals proved to be far more important than what we did know. As an incinerator generates hundreds of chemicals, including new compounds, we can expect many unpleasant future surprises. Here are a few examples from the past: Chlorofluorocarbons (CFCs) These chemicals were touted as the safest chemicals ever invented when first synthesised in 1928. Thomas Midgeley received the highest award from the chemical industry for his discovery. After 40 years on the market suspicion fell on them. They were producing holes in the ozone layer exceeding the worst case scenario predicted by scientists. Polychlorinated biphenyls (PCBs) These chemicals were introduced in 1929. Toxicity tests at the time showed no hazardous effects. They were on the market for 36 years before questions arose. By that time they were in the body fat of every living creature in the planet and evidence began to emerge of their endocrine disrupting effects. • Pesticides Early pesticides included arsenical compounds but these killed farmers as well as pests. They were replaced by DDT. Paul Muller was awarded the Nobel Prize for this discovery as it was considered a milestone in human progress. But DDT brought death in a different way and it was another two decades before it was banned. Less persistent pesticides then came onto the market but they had yet another unanticipated problem �C endocrine disruption. Tributyl tin (TBT) In the early seventies scientists noted irreversible damage was occurring to the reproductive system of fish and shellfish, especially clams, shrimps, oysters, Dover Sole and salmon. It was 11 years before the cause was found and it was found to be due to be tributyl tin, a chemical added to paint to stop barnacles growing. Incredibly the damage was occurring at a concentration of just five parts per trillion. By the end of the eighties more than one hundred species of fish were known to have been harmed.
This pattern of unanticipated disasters and long latent intervals before their discovery characterises the history of many toxic chemicals and warrants great caution in the use of new compounds. Animal studies almost never warn us of the uniquely human neurotoxic effects on behaviour, language and thinking. In the case of lead, mercury and PCBs the levels of exposure needed for these effects to occur have been overestimated by a factor of 100 to 10,000285. To quote Grandjean283 ��Past experiences show the costly consequences of disregarding early warnings about environmental hazards. Today the need for applying the Precautionary Principle is even greater than before�� 8. Alternative Waste Technologies An ideal waste strategy would produce no toxic emissions, no toxic by-products, no residues that need landfilling (zero waste), good recovery of materials and be capable of dealing with all types of waste. This might seem a tall order but with a combination of approaches, it is now possible to come quite close to this goal. Once this aim is made clear then incineration becomes a poor choice. The potentially dangerous emissions to air, the high volume of ash that needs landfilling and the very toxic nature of the fly ash would rule it out. Similarly pyrolysis produces toxic by-products and is best avoided. The most important component of an integrated strategy must be some form of separation and recycling. We must also look at methods of dealing with residual waste that produce no ash, such as Mechanical-Biological Treatment, Anaerobic Digestion and Advanced Thermal Technologies. 8.1 Recycling, Re-use and Composting Both government guidance and the European Union Waste Hierarchy make it clear that recycling and re-use are the highest priorities in waste management and that this should take precedence over incineration and landfill. This hierarchy has been described as reduction, reuse, recovery and disposal. Many fine words have been spoken, but the reality is, that without incentives to support recycling, both the increase in landfill tax and the European Directives to reduce the amount of biodegradable waste going to landfill are driving waste management towards its lowest priorities, principally incineration. This has now becoming the easiest option for local authorities. Waste policy is veering away from its stated highest priorities with their low environmental impact towards the least sustainable options which have the highest environmental impact. The net effect of this is that incineration, with its large appetite for high calorific recyclable materials, is now in direct competition with recycling and has become an obstacle to sound waste policy. This is an inversion of the Waste Hierarchy and removes the motivation to re-use and recycle. One way forward would be to use the strategy already employed by several countries such as Sweden and the Netherlands, where waste cannot be delivered to landfill or incinerators without having undergone separation or treatment. In effect, this stops the sending of recyclable items to landfill and incineration. About 46% of municipal waste consists of paper, cardboard, fabrics, glass and metals �C all of which could be recycled. Metals are becoming more valuable and are already being mined in dumps in parts of the world. About 32% consists of garden and food waste which could be composted. Several commentators have emphasised that, for recycling programs to work successfully, it is important to have systems in place that are easy to use. Doorstep collections of organic waste are especially important. Another 13% of waste is plastics which are discussed below. The UK presently recycles about 23% of its waste. Many other countries recycle a far higher proportion of their waste with Norway, Austria and Holland achieving over 40% and Switzerland over 50%. St Edmundsbury in the UK has reached 50%. Below is a table showing that many areas have achieved high rates of municipal waste diversion (recycling, re-use and composting) and this demonstrates that diversion rates of 50-70% are realistic targets. Locality Diversion Rate (percent) Zabbaleen-served areas of Cairo, Egypt 85 Opotiki District, New Zealand 85 Gazzo (Padua), Italy 81 Trenton, Ontario 75 Bellusco (Milan), Italy 73 Netherlands 72 Northumberland County, Ontario, Canada 69 Sidney, Ontario 69 East Prince, Prince Edward Island, Canada 66 Boothbay, Maine, U.SA 66 Halifax, Canada 65 Chatham, New Jersey, U.SA 65 Falls Church, Virginia, U.SA 65 Galway, Ireland 63 Belleville, Ontario 63 Canberra, Australia 61 Bellevue, Washington, U.SA 60 Guelph, Ontario, Canada 58 Gisbome District, New Zealand 57 Cfifton, New Jersey, U.SA 56 Loveland, Colorado, U.SA 56 Denma~ 54 Bergen County, New Jersey, U.SA 54 Worcester, Massachusetts, U.SA 54 Leverett, Massachusetts, U.S.A. 53 Ann Arbor, Michigan, U.S.A. 52 Crockett, Texas, U.S.A. 52 Dover, New Hampshire, U.SA 52 Kaikoura District, New Zealand 52 Switzerland 50 Nova Scotia, Canada 50 Portland, Oregon, U.SA 50 Madison, Wisconsin, U.SA 50 Fitchburg, Wisconsin, U.SA 50 Visalia, California, U.SA 50 8.2 Producing Less Waste However efficiently we recycle, re-use and compost, these cannot solve the waste problem without another vital step; namely producing less waste in the first place. To emphasise this point, the amount of municipal and business waste in the UK is still growing286 in spite of higher rates of recycling. Various solutions to this are gaining popularity. One is Extended Product Responsibility (EPR) where firms take physical and financial responsibility for products even after they are sold, collecting their products and packaging after use. This encourages firms not to produce non-recyclable and non re-usable products. It has been applied to packaging, tyres, and electronics. EPR needs to be extended but where this is not practical, such as where products are hazardous or non-recyclable, then a product ban might be appropriate. A further solution would be to tax non-recyclable items to discourage their production. There is a further aside to this issue which has yet to be addressed by governments. The developed world is producing, and disposing of, increasing amounts of goods of all kinds, including large amounts of synthetic materials unknown a century ago. The rest of the world is not unnaturally wanting to share the prosperity, but we are rapidly reaching a point where continuing even at the present level will become impossible because we are running out of both energy and of essential materials, particularly oil. We have finite sources of oil from which so many materials are made. We are probably close to reaching peak production and this resource will diminish over the next few decades at a time when demand is increasing internationally. Natural gas will peak a decade or two later and then diminish. The only other two major sources of energy would be coal and nuclear power. Nuclear energy, even in the unlikely event that a safe way could be found to deal with the radioactive waste, would last between 8 287 and 17 years 288 if it was supplying 20-25% of the world��s energy because uranium is also a finite resource. Burning coal could cause a disastrous increase in greenhouse gases. Again it could not make up for the shortage of energy and would last less than a century289. At present it appears that genuinely renewable sources of energy could provide, at the very most, 40% of our present energy requirements289 . (In reality it is likely to be much less and it has been estimated renewable sources will produce 4¾ % of total energy and 22% of electricity by 2020 in the UK).290 Different experts will have their own opinions on all of these figures, but one thing is certain: -we are running out of energy. We can anticipate a 20% reduction in energy from all sources in 40 years and a 40% reduction in 60 years289. Long before this happens the price of energy and of goods made from oil will soar. There is only one possible solution to this problem in the long term and that is to reduce our use of energy which means reducing our production and consumption of goods, and preserving our resources, including the valuable components in our waste. 8.3 Zero Waste Zero waste, initially introduced in New Zealand has been taken up successfully by other regions and cities such as San Francisco, The Philippines, Flanders, Canberra, Bath and North East Somerset. In the UK, 71% of councils have committed to zero waste as part of their plan. This means working towards a goal of producing zero waste and avoiding disposal in landfill and incineration. The policy of the European Union is already on the path towards zero waste. Zero waste and incineration are mutually incompatible. There are some difficulties with zero waste. One is that not all materials can be recycled and there will be some residual waste, notably plastics. Other goods contain mixed ingredients (for example envelopes containing plastic windows) and cannot easily be recycled. These could be taxed or banned. Some areas such as Flanders in Belgium have recognised this problem and have innovatively set a target for residual waste, currently 150kg per capita per year (UK: 400kg per capita per year). This is a useful idea and the policy sends out a strong signal to manufacturers to produce recyclable products. 8.4 The Problem of Plastics A large amount of our waste is plastics and related materials such as PVC. Presently only two types of plastics can be recycled. The first key question is what will we do with these non-recyclable plastics? The second key question is how do we make chlorinated plastics safe for the future, taking into account that their highly persistent and toxic nature? The third key question is can we use plastics as a future resource? These are not small issues. For example, we use 500 billion carrier bags each year. They are used for an average of 20 minutes and are virtually indestructible, lasting for centuries. Many end up as microscopic tilth in the oceans. They then find their way into the food chain via lugworms and barnacles. Incineration is a poor answer to these issues as many plastics are organochlorines and form toxic products, notably dioxins, when burnt. In addition an important resource is wasted. We use about 3-4% of our oil to produce these plastics and it makes no sense to simply burn them. The best solution would be to stop making chlorinated plastics in the first place in view of their persistence and toxicity. Instead we could make biodegradable plastics (but note these will break down to form the greenhouse gas methane). Another answer is plasma gasification. Plasma gasification, unlike incineration can convert chlorine-based plastics back to their original starting material, namely salt and water and synthesis gas (carbon monoxide and hydrogen). Further procedures can be used to convert synthesis gases into highly useful materials: fuels such as ethanol and Fischer-Tropsch diesel (a cleaner form of diesel) or ethylene to produce more plastics. It other words it could be used to both detoxify and reform plastics. 8.5 Anaerobic Digestion of Organic Matter The problems of landfills are threefold. One is the production of greenhouse gases, principally methane. The second is the seeping of chemicals from landfill sites into aquifers. The third is lack of space. The former is the most urgent problem to solve. The methane is produced by organic waste, in other words rotting organic matter, but not by plastics (except bio-degradable ones) or metals. At present the methane is burnt in a flare tower or gas generator plant at the landfill site. However this is very inefficient. A far better option is to remove the paper, plastics and metals and allow the waste to break down in an anaerobic digester. The methane can then be burnt in a combined heat and power plant to produce electricity and heat. As this occurs in a sealed unit the environmental impact is much less than a landfill gas power plant. If this type of facility was used for the majority of agricultural waste and sewage then it could supply 3% of the UK��s electricity and would also displace carbon emissions284. 8.6 Mechanical Biological Treatment (MBT) This treatment is used extensively in Germany, Italy and Austria, has been in use for over 10 years and is due to be introduced into the UK. The process involves a mechanical stage in which the waste is chopped up into fragments and then separated by being put through screens of various sizes and past magnets. This process will separate the waste into fractions which can be used for different purposes. For instance metals, minerals and hard plastics can then be recycled. Paper, textiles and timber can also be recovered. Organic matter can then be broken down by composting �C this is the biological treatment. This can be achieved by exposing the waste to atmospheric oxygen or it can be broken down in the absence of oxygen (anaerobic digestion). The remaining rubbish can then be landfilled. This process is virtually pollution-free unless the remaining pellets are burnt with all the risks this entails. With MBT most of the original goals are being met. It fails on two counts only. Firstly there is some residue that needs landfilling �C this is a minor point but the second is more serious: MBT cannot cope with all types of waste as it is not suitable for hazardous waste. This is important as the amount of hazardous waste is likely to increase. So MBT needs to be part of a system. Note that residues from MBT have had the organic matter removed, so they will not produce the problematic greenhouse gases. For this reason we believe it is wrong that it incurs the full landfill tax as happens at present. 8.7 Advanced Thermal Technologies (ATT) and Plasma Gasification In contrast with non-thermal methods, any thermal method of dealing with waste carries an inherent risk of causing fatalities. Because of this thermal methods should only be used for residual waste after full separation of recyclables has taken place. If thermal methods are used, these should always be the safest ones available. In effect this means plasma gasification or gasification using the Thermoselect process. Japan has more experience of incineration than any other country and has started to use plasma gasification as a safer alternative to incineration. Plasma gasification is also in use in Canada. Plasma gasification achieves the final objective by disposing of the residual waste after separation and recycling and other separating technologies such as mechanical-biological treatment. It can deal safely with the most hazardous types of waste and can produce up to three times as much energy as incineration. Gasification has been employed by the natural gas industry for over 80 years but has not, so far, been used extensively for dealing with waste, although such plants are now in operation in Italy, Switzerland, Germany and Japan. Gasification produces high temperatures and can thermally decompose complex and hazardous organic molecules into gases and benign simple substances. Plasma refers to the gas when it has become ionized and this happens when an electric current is passed through the gas. A very important distinction from incineration is that it does not produce ash. The gas cleaning process can convert many contaminants into environmentally benign and useful by-products. The abatement equipment of incinerators and gasification units is very different. If the abatement equipment in an incinerator fails, as is all too common, people downwind from the installation will be subjected to dangerous pollution. If the abatement equipment in a gasification unit fails it will cause serious damage to the plant itself �C so the plant has to be built to a much higher quality. In a plasma gasification plant, the residual toxic substances including metals become encapsulated in silicate which is like being encased in stone. The plant will remove the toxic and persistent compounds from plastics and other chemicals and reform them. A good quality plasma gasification unit will not produce any adverse residues or by-products, only synthesis gas, silica, sulphur and salt. Synthesis gas is a useful by-product which can be used as a fuel; �� a major financial advantage which allows the capital costs of the unit to be paid within a 7 year period. Although it is a relatively expensive process, it is far cheaper than incineration once the health costs are taken into account (see section 9.1). Note also that it would not incur costs under the European Union Emissions Trading Scheme, potentially saving millions of pounds annually. A recent review of plasma gasification considered it to be a promising alternative to older technologies and that the present climate favoured the adoption of advanced technologies for waste treatment291. If it is combined with MBT and recycling, then only a small unit would be needed. It is important to realise that gasification systems can vary in quality and therefore safety. It is crucial that there is a good gas cleaning system which goes through 7 or 8 stages. It is also essential that temperatures of 1500 C are achieved -enough to break down organochlorines and convert them back to their original safe form, salt and water. Organochlorines are probably the most problematical group of chemicals on the planet so a real benefit of this technology is that this process reverses of the chlor-alkali process that produces organochlorines in the first place 8.8 Greenhouse Gases Incineration has been sold as a source of green energy and even more bizarrely as a source of renewable energy. This is far from the truth. In a recent report, incineration was found to be second only to coal fired power stations as a producer of greenhouse gases. However this is only part of the problem. With incineration there are two releases of greenhouse gases �C once when the material is burnt and another when it is re-manufactured. Once we add to the equation the carbon and other greenhouse gases produced when these products are remade, as opposed to being recycled, then it becomes obvious how wrong it would be to regard incineration as a source of green energy. In fact, between two to five times more energy goes into remaking products than the energy recovered from incinerating them292. Recycling is far more energy efficient than incineration and has greater carbon benefits. With the high rates of methane capture assumed by DEFRA, landfill has similar CO2 emissions to incinerators. All incinerators should be routinely assessed for their effect on global warming. 9. The Costs of Incineration 9.1 Direct and Indirect Costs Incineration has been reported to be more expensive than alternative waste strategies even when health costs are not considered. A recent document from the Scottish Environmental Protection Agency estimated that the disposal costs to process a tonne of waste would be £50-80 for incineration compared to £30-40 for aerobic digestion. These costs include high transportation costs and the equivalent figure for England would be £20-30 lower per tonne (making it approx £25-55 per tonne for incineration and £5 per tonne for aerobic digestion). The capital costs of aerobic digestion would be about half that of incineration293 . It is likely that the waste industry will come under the European Union Emission Trading Scheme (ETS) within the next 10 years, in an effort to offset carbon emissions. This would greatly increase the cost of incineration. Two tonnes of carbon are produced for every tonne of waste burned. The present cost per tonne of carbon, under ETS, will be around €20 and this cost will gradually increase, which would add approximately £30 to each tonne of waste burned. Councils will then be committed to paying an escalating cost, starting at £12 million per annum (for a 400,000 tonne a year incinerator) for up to 25 years*. It is a travesty that this cost should fall on local taxpayers subjected to this pollution which they did not ask for and which could be putting their own health at risk. We believe that many councils may be unaware of the implications of Emissions Trading Scheme. Another consideration councils may be unaware of is the financial impact of Renewable Obligation Certificates. Basically some waste disposal systems will attract these certificates, whilst others will not. The systems that attract ROC credits could produce very significant increases in income. These would be worth millions of pounds per annum for the waste companies operating such plants and for council taxpayers in areas where waste companies operate such equipment on their behalf. Incinerators generally attract no ROC payments. An exception to this is a CHP (combined heat and power) incinerator which attracts a payment of 1 ROC, or a fraction of an ROC, per megawatt hour of power generated **. Plasma gasification and anaerobic digestion attract a payment of 2 ROCs, or associated fraction, per megawatt watt hour of power generated. These technologies are not only far safer but this payment also makes them a much more attractive financial proposition. The implication of this is that a 200,000 tonne per year incinerator would attract no payment but a 200,000 tonne per year plasma gasification unit would attract a payment of £4.9 million per annum ***. This would allow the waste company to offer a substantial reduction in their charge to the council for each tonne of waste received. This would, in turn, lead to large savings for both council taxpayers3. However, calculation of the total costs of different methods of getting rid of waste must not only include the set-up and running costs but also the environmental, human and health costs. In the case of incineration, human and health costs are substantial but tend to be overlooked because they come out of another budget. However the health costs will have to be paid for and must be included in the equation. Dealing with the ash produced by incinerators represents another major cost to society, which again will come out of someone else��s budget. These are not small costs and to give some idea of the magnitude of the costs involved, it was estimated that in 1992 the bill for remediating all the contaminated waste sites in the USA was $750 billion294 . * Although these charges will be directed at the waste producer, contract clauses protecting them will ensure these high costs are passed on. ** ROC payments related to renewable energy generated by waste facilities are based on the percentage of feedstock that can be classed as renewable. Waste is not a wholly renewable substance and is deemed by Ofgem to contain 50% renewable content. Therefore, only half a megawatt of renewable electricity will be generated when one megawatt overall is generated. As a consequence of this, the megawatt generated will only attract half an ROC. *** a 200,000 tonne per annum plasma gasification unit would burn 24 tonnes per hour producing 14 megawatts per hour or 122,640 megawatt hours per annum. It is assumed that 50% of this fuel is renewable and hence there will be a rebate of 50% on the 122,640 megawatts of electricity produced (2 ROCs per MWh x 0.5). Each megawatt would attract a payment of approximately £40. This amounts to a saving of £4.9 million pounds per annum. 9.2 Health Costs of Incineration The health costs of incineration are huge. A 1996 report by the European Commission suggested that for every tonne of waste burnt there would be between £21 and £126 of health and environmental damage, meaning that a 400,000 tonnes per year incinerator would cost the tax-payer between £9,000,000 and £57,000,000 per year295: this figure was based on earlier data when emissions to air were somewhat higher so now these costs would be expected to be less. (However note the corresponding increase in costs that is now needed to make fly ash safe. The better the pollution control the more toxic the residues will be and the more expensive they will be to deal with.) Studies that have tried to estimate the combination of all these costs of incineration have come up with astonishingly high figures. DEFRA��s report in 2004 found that the health costs from PM10 particulates from incinerators alone, using a central to high estimate, would be £39,245 per tonne of particulates emitted (NB not per tonne of waste burnt)296. A 400,000 tonne per year incinerator would produce about 24,000kg (24 tonnes) of particulates per year and the DEFRA estimate of health costs would be £941,000 per annum. However DEFRA looked at 13 studies of PM2.5 and PM10 particulates and noted that the health costs ranged from £2,000 -£300,000 per tonne for PM2.5s and £1,800 - £226,700 for PM10s. These estimates were based on modelling data which for reasons described in section 12 are likely to underestimate particulate emissions. In particular they do not take into account recent data demonstrating high levels of pollutants emitted during start-up and shut-down. It is therefore reasonable to assume that the actual health costs would be at the higher end of the range, with a cost of £226,700 per tonne for PM10s and £300,000 per tonne for PM2.5s giving a total health cost per annum for particulates alone of £6.5 million ****. To give a realistic estimate of the health costs of incineration, the additional costs from the other pollutants must be added to this. In a review of health costs of incineration Eshet297 noted the complexity and difficulty of these calculations, with estimates varying between $1.3 and $171 per tonne of waste burnt. A study of British incinerators estimated the cost to be between $2.42 and $13.16 per tonne of waste burnt298. Most of these studies do not take into account the cost of ash, the cost of clean-up of accidents or water contamination or the more subtle health effects such as behavioural changes, reduction in IQ, reproductive and hormonal effects which have become apparent in recent years with many pollutants such as lead and organochlorines. For this reason it is likely the costs are considerably higher than estimated. Based on the findings of all these studies we can estimate that a 400,000 tonne a year incinerator will cause millions of pounds worth of health damage annually. These large health costs alone clearly demonstrate that incinerators make a poor choice for waste management. When a single incinerator can generate health costs of many millions of pounds every year, according to the government��s own data, it is absurd to argue that incinerators are safe. It is hard to see any justification for these huge health costs when other methods such as mechanical biological treatment (MBT), aerobic digestion and plasma gasification with low environmental and health costs (see section 8) are available. These methods have not being given sufficient consideration in the UK. MBT is relatively cheap but plasma gasification is more expensive to install. However, if the health costs are taken into account plasma gasification is very much cheaper than incineration. It makes no logical sense to use a method of waste disposal that has a total cost far in excess of other methods. And we must ask is it morally acceptable to knowingly incur such high health costs. **** This calculation is as follows. The Quality of Urban Air Review Group has estimated that the PM2.5 fraction of total particulates is between 28% and 100%. Leaving aside the likelihood that the PM2.5 fraction is higher from incinerator emissions an average figure of 60% PM2..5s would be likely. This calculation therefore estimates that a 400,000 tonne incinerator would produce 24 tonnes of particulates, that 60% would be PM2.5 particulates at a cost of £4.32 million per annum and 40% would be at the lower cost for other PM10s costing £2.18 million per annum. The total cost in health damage from particulates would therefore be £6.5 million per annum. 9.3 Financial Gains from Reducing Pollution The EC Okopol report of 1999299 calculated that every pound spent on pollution abatement saved £6 in health care costs and £4 in social security costs. A report from the US Environmental Protection Agency also reckoned that every dollar spent on abatement saved 10 dollars in health costs. In addition, a White House study by the Office of Management and Budget in 2003 concluded that enforcing clean air regulations led to reductions in hospitalisations, emergency room visits, premature deaths and lost workdays which led to a saving of between $120 and $193 billion between October 1992 and September 2002. This is an underestimate as it did not look at other health savings such as prescription costs and primary care costs. Few other measures today would give so dramatic a health benefit and such a large saving in health costs300 . 9.4 Other Studies of the Health Costs of Pollution Recent studies have drawn attention to the huge unanticipated costs to society of pollution from other sources. The International Joint Commission��s Science Advisory Board, the Workgroup on Ecosystem Health (SAB-WGEH) looked at a series of health problems where there was hard evidence for environmental causation. Reasoned arguments suggested that the contribution made by toxic substances to these health problems was between 10 and 50%. Four health problems which they considered concern us here, because they involve pollutants similar to those released from incinerators. These are neurodevelopmental defects, hypothyroidism, loss of 5 IQ points and Parkinson��s disease. The cumulative costs in the USA for these disorders alone were considered to be between $370 and $520 billion per year. Even using the lowest estimate of environmental contribution (10%), the costs due to pollutants was $40 billion dollars annually301. The WWF investigated three conditions �� mental retardation, cerebral palsy and autism �� to assess the impact of chemical pollution, and calculated the cost of toxic chemicals on children��s brain development to be approximately £1 billion annually302. 10. Other Considerations of Importance 10.1 The Problem of Ash The incineration of waste produces a large amount of ash, amounting to 30% of the weight of the original waste; 40-50% of the volume of compacted waste. This is important as landfill sites are becoming less and less available so there is an urgent need for a workable alternative. It is clear that incineration will not solve the landfill problem since it can only reduce the bulk by just under half. Little thought has been given to this and incinerator operators are still being given 20 to 30 year contracts creating problems for the future. Incinerators produce two types of ash, bottom ash and fly ash, sometimes called air pollution control (APC) residues. The latter is highly toxic and listed as an absolute hazardous substance in the European Waste Catalogue. It has high concentration of heavy metals and dioxins. Many substances such as metals have little toxicity before incineration but become hazardous once converted to particulates or fine particles in the ash. In fact, the combination of pollutants in the fly ash can amplify the toxicity. Using a biological test, researchers found that the toxicity in fly ash was five times greater than could be accounted for by the content of dioxins, furans and PCBs303 . There is a basic problem with modern incinerators. The less air pollution produced, the more toxic the ash. Early incinerators emitted large volumes of dioxins. These emissions have been significantly reduced, but at the cost of a corresponding increase in the fly ash, with similar increases in heavy metals and other toxic chemicals. An incinerator burning 400,000 tonnes of waste annually for its 25 years of operation would produce approximately half a million tonnes of highly toxic fly ash3. Apart from vitrification, no adequate method of disposing of fly ash has been found. The EU Commission have stated that leaching from landfill sites may be one of the most important sources of dioxins in the future. Heavy metals are known to have high leachability. The US Environmental Protection Agency considers that all landfills eventually leach through their liners. As most of these pollutants are persistent, probably lasting for centuries, they will sooner or later threaten the water table and aquifers where their removal would be near impossible. Allowing this to take place is an abdication of our responsibility to future generations. In spite of the massive health risks associated with fly ash it is poorly regulated. At Byker, near Newcastle-upon-Tyne, 2000 tonnes of fly ash laden with dioxins was spread over allotments, bridle paths and footpaths for six years between 1994 and 2000. This cavalier approach to managing toxic waste appears to have changed little. In January 2008, a recently permitted hazardous waste site at Padeswood (for storing fly ash from a cement kiln) was flooded. Fortunately no hazardous waste had been stored at the time otherwise it would have carried the toxic waste into brooks and thence into the River Alyn from where drinking water is extracted. Workers are often exposed to this ash without protective gear. Even today this material has been foolishly used for construction purposes ignoring its toxic properties and the potential for the release of pollutants during use and from ordinary wear and tear. Fly ash needs to be transported away from the incinerator and this can involve lengthy journeys. These represent an important hazard. An accident could potentially make an area uninhabitable, as happened at Times Beach, Missouri, due to dioxin-contaminated oil. These potential costs have yet to be factored into the cost calculations of incinerators. Bottom ash is a less severe hazard, but still contains significant quantities of dioxins, organohalogens and heavy metals. It is extraordinary that whereas regulations have tightened in recent years to reduce dioxin emissions to air, bottom ash, which contains 20 times more dioxin, is unregulated and bizarrely is regarded as inert waste. This misclassification had allowed it to be charged at the lowest rate at landfill sites. We believe this is wrong: it is not inert and should not be classified as such. It should be charged at a rate that is in keeping with its toxicity. The Stockholm Convention makes it clear that dioxins and furans should be destroyed, which currently means using vitrification. In Japan, this is done responsibly and much of the fly ash is now treated by plasma gasification but this essential safety step has been neglected in the UK. Because of the toxicity of bottom and fly ash there should be a full assessment of the cost of a clean-up operation for both water and land contamination. Environmental clean-up costs should be shown as part of the cost of incineration, and, when relevant, of other waste disposal strategies. 10.2 Radioactivity a) Associated with Incinerators Over thirty sites in the UK incinerate radioactive waste. Most countries consider this too hazardous. The majority of radioactive waste incinerated in the UK is alpha or beta emitting radiation. These types of radiation are not very dangerous outside the human body due to their short range (within tissues this is millimetres for alpha particles and centimetres with beta particles), although beta radiation can penetrate the skin. Once incinerated this relatively safe material is converted into a highly dangerous and sinister pollutant. During incineration, billions of radioactive particulates will be formed and emitted into the air. These may be inhaled by anyone unfortunate enough to be downwind at the wrong time, and pass through the lungs and circulation and then into the cells. Once inside the body it will continue to emit radiation. Alpha radiation has a very short range but great destructive power. Both alpha and beta radiation will be highly destructive and carcinogenic to nearby tissues. Each one of the billions of radioactive particulates emitted represents a very real danger. There can be no safe threshold for this material. The risk from this policy is obvious. Safety regulations bizarrely make no distinction between internal and external radiation even though these are markedly different. For instance Beral found that prostate cancer was higher in workers in the nuclear industry. There was no correlation with external radiation but a highly significant correlation with internal radiation304. Animal studies make this even more clear and rats injected with 0.01mGy of Strontium 90 were found to have pathological damage even though the dose was 200 times less than background radiation305 . Of more concern is the fact that transgenerational effects have also been demonstrated. Mice two generations from a male injected with this Strontium 90 suffered lethal genetic damage, demonstrating that chromosomal damage was passed through the genes to the offspring of irradiated mice306. Many people would be surprised to know just how small a dose of radiation is needed to cause harm. After Chernobyl sheep were monitored for Strontium 90 and the limit set was 0.00000000019 grams per kilograms of meat, so small it would be invisible307 . And yet regulations allow billions of particulates containing similarly minute quantities of radioactive material to be emitted into the air from incinerators. In contrast, natural background radiation is, at most, a minor hazard. For instance Aberdeen has double the level of natural background radiation but no increased risk of leukaemias or cancers. b) Associated with Other Sites Increased incidence of leukaemias and cancers around sites releasing radioactive material are well documented. At Seascale a public health enquiry found children were more than ten times more likely to get leukaemia and three times more likely to get cancer308,309. The incidence of leukaemias in children living within 5 kilometres of the Krummel and Goesthact nuclear installations in Germany is much higher than in Germany as a whole. Significantly, the first cases of leukaemia only appeared five years after Krummel was commissioned. At Dounreay there was a sixfold increase in children��s leukaemia310 and at Aldermaston there was also an increase in leukaemias in the under fives311. Sharply rising leukaemia rates were noted in five neighbouring towns surrounding the Pilgrim nuclear plant in Massachusetts in the 1980s. It was thought to be linked to radioactive releases from the Pilgrim nuclear plant ten years earlier where there had been a fuel rod problem. ��Meteorological data showed that individuals with the highest potential for exposure to Pilgrim emissions had almost four times the risk of leukaemia compared to those having the lowest potential for exposure��312,313. A recent meta-analysis of 17 published reports that covered 136 nuclear sites across the world took a global look at the problem. They found death rates from leukaemia in children under the age of 9 were increased by 21% and in those under 25 by 10%314. They noted that discharges from these plants have been too low to account for the leukaemias using standard criteria (based on single or intermittent high dose radiation). The likely explanation here is internal radiation where a minute dose taken internally would be enough to trigger a cancer or leukaemia. This should be seen as a strong warning about the danger of incinerating and dispersing radioactive matter into the environment. The weight of evidence here strongly suggests that airborne radioactivity is a potent carcinogen and likely to be extremely hazardous. To allow it at all is foolhardy but to combine this with a cocktail of other carcinogens is reckless. 10.3 Spread of Pollutants The National Research Council, an arm of the National Academy of Sciences, that was established to advise the US government, concluded that it was not only the health of workers and local populations that would be affected by incinerators. They reported that populations living more distantly are also likely to be exposed to incinerator pollutants. They stated ��Persistent air pollutants, such as dioxins, furans and mercury can be dispersed over large regions �C well beyond local areas and even the countries from which the sources emanate. Food contaminated by an incinerator facility might be consumed by local people close to the facility or far away from it. Thus, local deposition on food might result in some exposure of populations at great distances, due to transport of food to markets. However, distant populations are likely to be more exposed through long-range transport of pollutants and low-level widespread deposition on food crops at locations remote from an incineration facility.��315 They later commented that the incremental burden from all incinerators deserves serious consideration beyond a local level. This has obvious relevance to the present policy of promoting incinerators in the UK. An important point is that the more toxic smaller particulates, which typically have more toxic chemicals and carcinogens attached, will travel the furthest.316 Most chemical pollutants are lipophilic and are therefore not easily washed away by the rain after they settle. When they land on crops they enter the food chain where they bioaccumulate. It has already been admitted that most dioxin in food today in the UK came from the older generation of incinerators. All chemicals capable of entering the food chain will sooner or later reach their highest concentration in the foetus or breast fed infant. A striking example of the unforeseen and tragic consequences of releasing pollutants into the air has been seen in Nunavut, in the far North of Canada in the Polar Regions. The Inuit mothers here have twice the level of dioxins in their breast milk as Canadians living in the South, although there is no source of dioxin within 300 miles. At the centre of Biology of Natural Systems in Queen��s College, New York, Dr Commoner and his team used a computer programme to track emissions from 44,000 sources of dioxin in North America. This system combined data on toxic releases and meteorological records. Among the leading contributors to the pollution in Nunavut were three municipal incinerators in the USA317,318. 10.4 Cement Kilns Although this report is primarily about incinerators it is useful to compare incinerators with cement kilns. Both produce toxic emissions of a similar type and much of the report is relevant to both. Cement kilns convert ground limestone, shale or clay into cement. They require large quantities of fuel to produce the high temperatures needed and this lends itself to the use of non-traditional fuels such as tyres, refuse-derived fuel and industrial and hazardous wastes variously called Cemfuel, secondary liquid fuel (SLF) and recycled liquid fuel (RLF). However, pollution and planning controls are significantly weaker than those for hazardous waste incinerators. Cement kilns produce a number of toxic emissions similar to incinerators. Burning tyres produces emissions with dioxins and zinc and burning petroleum coke produces vanadium and nickel. Releases of mercury and arsenic are uncontrolled as these are vapourised. The risk from dioxins is considerably greater as most cement kilns do not have the activated charcoal needed to remove them. The risk from PM2.5 particulates is extremely serious. The limit set for the weight of all particulates emitted by incinerators is 10mg per cubic metre. However cement kilns are allowed to emit 30-50 mg per cubic metre. This would be excessive by itself but the volumes of emissions from cement kilns can be up to five times greater than incinerators. Therefore some cement kilns can produce emissions of particulates and other toxic substances which are in excess of 20 times that of incinerators under normal operating conditions. Worse still they have poorer abatement equipment and usually lack the activated charcoal needed to reduce emissions of metals and dioxins. The electrostatic precipitators need to be shut off when carbon monoxide levels build up due to the risk of explosion. This leads to unabated emissions. This has happened 400 times a year in one plant. The quantities of particulates released at these times are immense reaching 20,000mg per cubic metre which are the highest level that can be measured. Recent research has demonstrated unequivocally that small increases in PM2.5 particulates will increase cardiovascular and cerebrovascular mortality, so to allow releases of this order therefore borders on the negligent. Incredibly PM2.5 particulates are not routinely measured. Independently-audited monitoring by a registered charity at one cement kiln in the UK has continuously recorded levels of particulates, using 15 minute average readings319 . They have found extremely high surges of particulates, typically with peak readings occurring at night, sometimes several times a week, with maximum PM10 particulates reaching levels of over 4500 µg per cubic metre and maximum PM2.5 reaching over 170µg per cubic metre. Current scientific knowledge on particulates suggests that these levels would be expected to cause cardiovascular deaths and the findings demonstrate the urgent need for independent monitoring around all cement kilns. This monitoring has exposed major deficiencies in the present monitoring and regulatory system. Thermal treatment of hazardous waste is always a highly dangerous activity and the very best available technology needs to be used. Cement kilns are effectively being used to burn hazardous waste on the cheap. Sadly hazardous waste typically finds its way to the least regulated and cheapest disposal methods, in practise those that create the most health risks and the most environmental damage. Cement kiln technology has remained virtually unchanged since the turn of the twentieth century. They can only be refitted or retrofitted to a minimal degree to improve efficiency and toxic waste destruction. The Select Committee for the environment recommended studies on the safety of cement kilns over 10 years ago and this has been ignored. Why? Cement kilns are therefore capable of extremely serious health consequences. Incredibly some of these cement kilns have been sited in the middle of towns where they would be expected to have a major effect on the health of the local population. The fact that they are allowed at all is astonishing, for the maximum impact will inevitably be on the most vulnerable members of society, and in particular the unborn child. 11. Monitoring At the heart of the problems with incineration is the poor quality and unsatisfactory nature of monitoring at these installations, unsatisfactory in the way it is done, the compounds monitored, and the levels deemed acceptable, and the lack of monitoring of body burdens in the local population. The problems are as follows: Very Few Pollutants are being measured Out of the hundreds of chemicals released from an incinerator only a tiny proportion are measured. On current data, the three most important pollutants released by incinerators are dioxins, heavy metals and PM2.5 particulates. Incredibly these are virtually unmonitored. Only half a dozen pollutants are measured continuously in the stack and about another half dozen are measured occasionally (usually 6 monthly for the first year and then yearly) by spot monitoring �C these include heavy metals and dioxins. This is clearly unsatisfactory and since waste operators are warned in advance of a visit, they are handed an opportunity to change to burning cleaner waste which is unrepresentative of the toxic risk, making the exercise largely pointless. The Most Dangerous Pollutants are hardly being Monitored Accidental by-passing of pollution control devices by incinerators present very real dangers to people living in the vicinity of incinerators and this danger is compounded by the near absence of monitoring of dioxins. Two episodes serve to illustrate this. A modern state of the art incinerator in Rotterdam was found to be by-passing its pollution control devices 10% of the time emitting dioxins equivalent to 5 times the national limit over the city. In Norfolk, Virginia a similar incident led to dioxin emissions greater than the allowable combined limits for traffic, incinerators and industry for Sweden, Germany and the Netherlands combined. This would cause widespread pollution of an area with dioxin and other persistent pollutants that could last for decades, if not centuries, putting many generations at risk. Start-ups and shut downs of incinerators give rise to a similar danger. A recent study found that a single incinerator start-up would, on average, generate, over a 48 hour period, 60% of the total annual dioxin emissions produced during steady state conditions �C in other words 7 months worth of dioxin release within 2 days of a typical start-up. They also found that the levels of dioxins produced by start-ups at some of the incinerators they studied could be twice the annual dioxin emissions under steady state conditions (this is the equivalent of 24 months of dioxin release within 2 days)320. The danger to people living in the area is obvious and serious. High levels of dioxins can also be produced during shut-downs and during commissioning (when they are not monitored). Dioxins are only monitored at 3-12 month intervals and then only for a few hours. This means that dioxins are not monitored 99% of the time. It could therefore be many months before high levels of dioxin emissions were detected perhaps allowing enough dioxin to be released to threaten the health of a whole community and render farms in the vicinity unfit for growing vegetables or rearing livestock. In fact, the operator and the public might never find out and then steps would never be taken to deal with the consequences. An added problem is that spot monitoring (as is used currently) has been shown in a recent study to be unrepresentative and to underestimate dioxin levels by 30-50 times321. The situation is no better with heavy metals. Like dioxins, they are unmonitored for 99% of the time. Clearly, continuous dioxin monitoring is essential and without such monitoring, incinerators must be regarded as unsafe and a hazard to anyone living in the area. Continuous dioxin monitoring should be mandatory as is the case in some other European countries. Currently, monitoring of the three most important and dangerous pollutants, namely dioxins, heavy metals and PM2.5 particulates is virtually non-existent in the UK. In the case of PM2.5 particulates they are not monitored at all �C only the far less relevant PM10 particulates. Independent monitoring of cement kilns has already demonstrated very high particulate emissions that could seriously endanger health319. These releases have been frequent (sometimes 3 times a week), dangerous (reaching 4500µg per cubic metre of PM10 particulates) and have escaped detection by the regulatory authorities. Clearly, the present regulatory system is not protecting the public. The Standard of Monitoring on the Ground is also Unacceptable In addition to monitoring in the stack, there is a requirement to monitor pollutants in the surrounding air. This is normally done by the local council with monitors at ground level. However this is also unsatisfactory. For instance to monitor for safe levels of particulates it would require at least 24 monitors placed at strategic points around an incinerator (assuming the wind is distributed evenly) to achieve a 25% sampling rate, which is the minimum that can be considered acceptable3. Typically, there are less than three monitors around most incinerators today. Measurement of heavy metals in the surrounding air, with the exception of lead, is not even required. No Monitoring of Pollutants which have accumulated in the Neighbourhood Measuring concentration of pollutants released in the stack gives no information about the levels of toxic material that have accumulated in the vicinity. When the rate of discharge of pollutants into the environment is greater than the ability of the ecosystems to break them down then they must accumulate. We already know that many do not break down for centuries. The excretion rates of many pollutants from the human body are also very poor, for example the half life of cadmium in the body is 30 years and for PCBs it is 75 years. Many pollutants, being fat soluble, will bio-accumulate in living matter at far high concentrations than in the ambient air. A US EPA memo admitted that the risk from accumulation of dioxin in farm animals ��could result in unacceptable health risks��. Using a type of risk assessment called screening analysis322 they calculated that dioxin would accumulate in cattle downwind from an incinerator and that the risk from beef and milk consumption would be 40,000 times the risk from inhalation. This is a massive increase in risk and is in keeping with what we already know about bioaccumulation in other species (see Section 3.4). Monitoring of dioxins in cattle and other farm animals regularly is essential for these reasons. Regrettably it is not being done and therefore consumers of these products are being put at risk. Checks for pollutants in dust, vegetation and in the bodies of local inhabitants are also necessary. It is sometimes argued that these pollutants don��t matter as they will be carried away in the wind and be someone else��s problem. Sadly this is partly true and that is the reason there is so much pollution in the fragile ecosystem in the Arctic where much of the toxic material ultimately ends up. Monitoring relies on Safety Data derived from Animal Studies Animal studies commonly underestimate human vulnerability because of the obvious difficulty in testing cognitive, behavioural and language deficiencies and conditions such as fatigue. In the case of lead, mercury and PCBs, animal studies have underestimated the neurotoxic effect on humans by a factor of 100 to 10,000 times285 . Monitoring Gives Little Protection to the Foetus Average levels or spot monitoring ignores exposures at critical times. The timing of the exposure is often more important than the concentration. Exposures at critical times during foetal growth or infancy are known to produce more serious effects than similar exposures in adulthood and this damage can be permanent. This is well recognised, especially with lead, mercury and PCBs. None of the safety limits has been demonstrated to protect against foetal damage. We know from animal and human studies that toxins have the greatest impact on the foetus and young child. The most vulnerable members of the community are likely to bear the brunt of these toxic releases. Many Pollutants have No Safe Threshold or show Low Dose Toxicity Some pollutants such as PM2.5 particulates, lead and dioxin have no safe thresholds. Most organochlorines are endocrine disruptors and thresholds may not exist for these effects. Monitoring gives little or no protection in these situations. Sometimes low dose studies have shown toxic effects at levels far below the ��no effect�� level in high dose studies. An example of this is bisphenol A, a plasticizer. Studies showed health effects at levels 2,500 times lower than American EPA��s lowest observed effect, with adverse outcomes including aggressive behaviour, early puberty and abnormal breast growth220. Perchlorate produces changes in the size of parts of the brain at 0.01 mg/kg/day but not at 30mg220 . Aldicarb was found to suppress the immune system more at 1 ppb than it did at 1000ppb. Other chemicals also produce different effects at low dose to what they do at high dose. This shows how very little we know about the dangers of exposing whole populations to chemical pollution. Pollution Offences are Commonplace and Regulation is Poor Ten incinerators in the UK committed 553 pollution offences in a two year period, documented in Greenpeace��s ��A Review of the Performance of Municipal Incinerators in the UK��. This appalling record led to only one prosecution by the Environment Agency. There is little point in tighter regulations if they are not enforced. Fines received for pollution offences have been compared to a person on a £50,000 salary receiving a £20 parking fine. This clearly gives waste companies a green light to ignore regulations and pollute with little fear of the consequences. The above data was based on self assessment by the companies concerned. Levels of emissions achieved under test conditions or when inspections occur by prior arrangements are likely to be far lower than under real life conditions. This was demonstrated in the United States in 1990 when the EPA and Occupational Safety and Health Administration conducted 62 unannounced visits and no less than 69% of inspections led to summons for violations of regulations323. (In the UK inspections are by prior arrangement). This makes a strong case for making all visits unannounced. When an environmental group investigated an incinerator in Indianapolis the situation was even worse. They found it had violated its permits 6,000 times in two years and bypassed its own air control pollution devices 18 times. In effect, incinerators present inherent and unavoidable hazards to public safety but the extent of the hazards depends on how well incinerators are run. The evidence is strong that they are often run badly. The situation is made worse by weak regulators with little appetite for enforcing public safety. 12. Risk Assessment One might reasonably expect that, when the decision to build an incinerator is made, all the above information would be carefully taken into account. Sadly this is not necessarily the case. Directors of Public Health, who usually have little knowledge of environmental health, are asked to write an IPPC (Integrated Pollution Prevention and Control) Application Report and give their opinion on the health risks from the proposed incinerator. Typically this decision is based on an inexact method called risk assessment. They tend to rely almost exclusively on this type of assessment and often have little understanding of its limitations. Risk assessment is a method developed for engineering but is very poor for assessing the complexities of human health. Typically it involves estimating the risk to health of just 20 out of the hundreds of different pollutants emitted by incinerators. It masquerades as a scientific measure but has all the hallmarks of pseudoscience. By pseudoscience we mean assumptions based on false premises: 1)It makes the assumption that any substance emitted but not assessed (this means 99% of all pollutants) should be treated as if they have zero risk. This assumption is obviously untrue. 2)It assumes wrongly that all pollutants have thresholds below which they are safe. Science contradicts this. Many pollutants, including dioxins, lead and radioactive particulates do not have thresholds and some may even be more dangerous at lower concentrations (see section 11). An international meeting of neurologists and endocrinologists concluded ��Chemical challenges in early life can lead to profound and irreversible abnormalities in brain development at exposure levels that do not produce permanent effects in an adult; there may not be definable thresholds for response to endocrine disruptors��324 . The National Research Council concluded in 1992 that ��the assumption of thresholds for neurotoxicity was biologically indefensible��225 . We might also note that the accepted thresholds for many pollutants have been progressively reduced over the last few decades (including vinyl chloride, ethylene dichloride and six chlorinated solvents) with reductions to between one half and one tenth of the original limits. We can expect further reductions as science progresses. 3)It assumes wrongly that only air emissions need to be considered and bioaccumulation in food can be ignored. However air emissions may be only the tip of the iceberg. Most food today is contaminated with dioxins, predominantly from past incinerator emissions. As noted in section 11, a leaked report in 1993 from the US Environmental Protection Agency calculated that dioxin would accumulate in cattle in a farm downwind of an incinerator in Ohio posing a risk to the frequent beef consumer which was 40,000 times higher than from inhalation alone. If the incinerator operated for 30 years the cancer risk from eating this beef regularly was calculated to be a massive 1,200 per million, far beyond acceptable risk322. We can assume this sort of risk from food produced near most incinerators occurs routinely and yet it is being sold to the public and regulators are turning a blind eye to the danger. 4)It misconstrues lack of evidence on the danger of pollutants as evidence of safety. The toxic effects of 88-90% of chemicals and pollutants are unknown325 . It is impossible to assess the risk of substances we barely understand. This is particularly true in relationship to birth and developmental defects. Many pollutants have not even been characterised, let alone assessed for risk. 5)It assumes that health effects such as infertility, immune suppression, altered behaviour and reduced intellectual capacity which are not included in the risk assessment can be ignored. However there is ample and increasing evidence that many pollutants have just these impacts. 6)It assumes wrongly that ecosystems have the ability to absorb and degrade all environmental pollutants. Again science contradicts this: many pollutants are known to be persistent and bioaccumulative. In fact, if the rate of input, however small, is greater than the rate at which they break down they must accumulate. It is equivalent to filling up a bucket under a slow dripping tap: sooner or later the water will overflow unless the source of water is stopped. 7)It assumes wrongly that the hazard posed by each individual compound tested out of context and in isolation can predict the hazard of complex mixtures of chemicals. In the real world pollutants typically occur in combinations and abundant evidence now exists that increased toxicity is common with multiple exposures. 8)It assumes wrongly that the cumulative pollution burden of all the emissions produced by all these facilities can safely be ignored and each facility can be considered in isolation. It is this type of limited thinking that has led to the contamination of entire ecosystems such as the Great Lakes, Baltic Sea, Mediterranean and Arctic. These pollutants pose global and multigenerational threats to health and ecosystems. 9) It assumes wrongly that we have a comprehensive understanding of the complexity of biological processes and chemical toxicity when in reality there are vast information gaps. This is why we have been constantly surprised by unpleasant discoveries like endocrine disruption and high body burdens in newborns. 10) It wrongly assumes all people will react in the same way to pollutants and in particular ignores the fact that the foetus is at far greater risk. Hidden within this type of assessment is a value judgement about what is an acceptable level of risk326 and this is not made explicit. For instance what is an acceptable number of birth defects and who is it acceptable to? A cancer risk of 1 per million is typically considered acceptable but may not be acceptable to the person affected by the cancer. Risk assessment usually involves ��modelling��; �C dispersion models use an estimation of exposure data, rather than actual exposure data, to assess the impacts of pollutants and their likely distribution. These reports are typically produced by the polluter. The models are not accurate -modelling has a 30% confidence level �C this means this technique has only a 30% chance of accurately predicting the ground level concentrations of pollutants -in other words less accurate than tossing a coin. Only about half the predictions are within a factor of two of actual (observed) concentrations and the rest are even less accurate. The models attempt to predict a worst case scenario but the models cannot accurately represent real worse case scenarios which typically occur when there is little or no wind leading to a build-up of pollutants. This means real worst case scenarios can be much worse than predicted327. Different models can give very different results. In addition, present modelling methods are not only inaccurate in estimating ground level pollutant concentration once emitted but they also seriously underestimate the quantities of pollutants emitted. In particular, modelling almost never takes into account secondary particulates formed as the products of combustion rise up the stack. These secondary particulates can double the total volume of particulates (see section 2.1). Modelling produces the illusion of a scientific knowledge and a certainty that is entirely unjustified by the imprecise nature of modelling and it is based on substantial scientific uncertainty and limited scientific data. It produces a mass of complex mathematical data, which implies unjustified precision, and it is difficult for people not familiar with the mathematics to disentangle the inaccuracies. This was summed up by the head of the EPA Carcinogen Assessment Group, Roy Albert, when he said ��Individuals with very different institutional loyalties can produce very different risk assessments from the same materials, where large uncertainties exist.�� In other words it is very easy to bias it towards the waste operator. It is often treated by regulators328 and Directors of Public Health as if it was an accurate assessment. In spite of these severe limitations it is extensively used. These risks assessments have almost always concluded that incinerators are safe which flies in the face of epidemiological data which shows the opposite. It also flies in the face of the history of chemical use. The latter is littered with examples of chemicals once said to be safe which were later found to have devastating and unanticipated effects, often beyond the worst case scenario (eg DDT, PCBs, CFCs) (see section 7.2). 13. Public Rights and International Treaties In 2001 the United Nations Commission on Human Rights stated that ��everyone has the right to live in a world free from toxic pollution and environmental degradation��. It is unethical that people should die from the emissions from incinerators when safe alternatives are available and for this reason incineration violates Article 2 of the European Human Rights Convention, the Right to Life. The Stockholm Convention, agreed to by over 100 countries including Britain, in 2001, commits countries to eliminating persistent organic pollutants, including PCB, dioxins and furans, calling for countries to prevent not just the release of these pollutants but also their formation. The formation of these substances is an inevitable consequence of the use of incinerators. The Convention also requires parties to take measures to reduce the total releases of these substances (which includes releases to fly ash). It identifies incinerators as primary sources of these compounds. Incineration is, in all these ways, a flagrant violation of the Stockholm convention. Incineration is also a violation of the Environmental Protection Act of 1990 which states that the UK must prevent emissions from harming human health. 14. Conclusions 1)Incineration does not remove waste. It simply converts it into another form (gas, particulates, ash) and these new forms are typically more hazardous though less visible than in the original form. 2)Large epidemiological studies have shown higher rates of adult and childhood cancers and of birth defects around incinerators. Smaller studies and a large body of related research support these findings, point to a causal relationship, and suggest that a much wider range of illnesses may be involved. 3) Recent research has confirmed that particulate pollution, especially the fine particulate (PM2.5) pollution, which is typical of incinerator emissions, is an important contributor to heart disease, lung cancer, and an assortment of other diseases, and causes a linear increase in mortality. The latest research has found there is a much greater effect on mortality than previously thought and implies that incinerators will cause increases in cardiovascular and cerebrovascular morbidity and mortality with both short-term and long-term exposure. Particulates from incinerators will be especially hazardous due to the toxic chemicals attached to them. 4)Other pollutants emitted by incinerators include heavy metals and a large variety of organic chemicals. These substances include known carcinogens, endocrine disruptors, and substances that can attach to genes, alter behaviour, damage the immune system and decrease intelligence. There appears to be no threshold for some of these effects, such as endocrine disruption. The dangers of these are self-evident. Some of these compounds have been detected hundreds to thousands of miles away from their source. 5)The danger of incinerating radioactive waste deserves special mention. Incineration converts radioactive waste into billions of radioactive particulates. These particulates make a near perfect delivery system for introducing the radioactive matter into the human body, where it can then act as an internal emitter of alpha or beta radiation. This type of radiation is qualitatively different, far more dangerous and far more sinister, than background radiation. There can be no justification for using this method of dealing with radioactive waste. 6) Modern incinerators produce fly ash which is much more toxic than in the past, containing large quantities of dioxin-rich material for which there is no safe method of disposal, except vitrification, a method not being used in the UK. Disposal of incinerator ash to landfill sites is associated with long-term threats to aquifers and water tables and the potential for accidents serious enough to require evacuation of an area. 7)The risks to local people that occur when incinerators operate under non-standard working conditions have not been addressed, particularly the emissions at start-up and shutdown which may be associated with the release, within 2 days, of more dioxin than over 6 months of working under standard conditions. 8)The greatest concern is the long-term effects of incinerator emissions on the developing embryo and infant, and the real possibility that genetic changes will occur and be passed on to succeeding generations. Far greater vulnerability to toxins has been documented for the very young, particularly foetuses, with risks of cancer, spontaneous abortion, birth defects or permanent cognitive damage. A worryingly high body burden of pollutants has recently been reported in two studies of cord blood from new-born babies. 9)Waste incineration is prohibitively expensive when health costs are taken into account. A variety of studies, including that from the government, indicate that a single large incinerator could cost the tax payer many million of pounds per annum in health costs. Put simply, the government��s own data is demonstrating that incinerators are a major health hazard. With the predicted inclusion of the waste industry within the EU European Emissions Trading Scheme, local taxpayers, in areas with incinerators, will not only have to live within a polluted area but will be saddled with costs, under ETS, of millions of pounds per annum to pay for it. 10) Waste incineration is unjust because its maximum toxic impact is on the most vulnerable members of our society, the unborn child, children, the poor and the chemically sensitive. It contravenes the United Nations Commission on Human Rights, the European Human Rights Convention (the Right to Life), and the Stockholm Convention, and violates the Environmental Protection Act of 1990 which states that the UK must prevent emissions from harming human health. 15. Recommendations 1) The safest methods of waste disposal should be used. 2) Health costs should be routinely taken into account when deciding on waste disposal strategies. 3) The present limited method of risk assessment by which the safety of proposed installations is judged, is inadequate, can easily be biased towards the waste operator, cannot be relied on, and should be reviewed. 4) Tackling the problems of both the amount and the nature of waste generated is of critical importance, with the emphasis on reducing the production of waste, and on recycling. 5) The serious health consequences of fine particulate pollution have become apparent in the last ten years: incinerators are a significant source and, for this reason alone, in our considered opinion, incineration is the least preferred option for getting rid of waste. Taking into consideration all the information available, including research indicating that there are no safe levels for fine particulates, the increasing amount of plastic and related substances in the waste stream and the highly toxic ash produced by modern incinerators, we can see no reason to believe that the next generation of incinerators would be substantially safer than the previous ones. 6) Far safer alternative methods are now available including recycling, mechanical biological treatment, aerobic digestion and plasma gasification: a combination of these would be safer, would produce more energy, would be cheaper than incineration in the long run and would be much cheaper when health costs are taken into account. Thermal methods should only be used for residual, non-recyclable waste and the safest thermal method should be chosen: currently this is plasma gasification. This not only produces more energy but can use plastics as a resource. These more advanced methods should be employed. 7) This report draws attention to the many deficiencies and poor quality of the present monitoring procedures. We recommend the introduction of a far stricter and more comprehensive system for the monitoring of all waste-burning plants by a fully independent body, including random unannounced visits: the monitoring should include: a)Continuous monitoring of dioxins �C this is an absolute essential and, not surprisingly, is mandatory in some countries. This vital step is essential because of the extremely toxic nature of the pollution emitted when incinerator pollution control devices are by-passed. The UK should not have the second rate safety standards that they have at present. b) Continuous monitoring of PM2.5 particulates and monitoring of PBDEs. c) A comprehensive system of monitors set up by Councils around all incinerators to measure particulates and heavy metals. d)Monitoring of dioxin in all livestock within a 5 mile radius of incinerators due to the known and serious risk from bioaccumulation in food. e) Periodic monitoring of the heavy metals and dioxins in the fly ash f) A programme of monitoring the body burdens of some key pollutants in local inhabitants. g) Periodic monitoring of the content of dust in homes in the locality 8) It is particularly important that incinerators should not be sited in deprived areas or areas with high rates of mortality where their health impact is likely to be greatest. This can only add to health inequalities. (NB. Presently 9 out of 14 incinerators have been built in the most deprived 20% of wards329). 9) The present subsidies and tax advantages, which favour incineration, should be removed. A ban or tax on recyclable material going to incinerators or landfill deserves serious consideration. It is nonsense to regard bottom ash, with its significant dioxin content, as an inert substance and it should incur landfill tax at a higher rate. 10) We recommend that no further waste incinerators be built. References: Section 2. Emissions from Incinerators and other Combustion Sources 2.1 Particulates 1) EC (1998) Proposal for a Council Directive on the incineration of waste. Brussels 07.10.1998 COM (1999) 558final. 98/0289 (SYN). 2) Howard C V (2000) In Health Impacts of Waste Management Policies. Hippocrates Foundation, Kos, Greece 12-14 Nov 1998. Academic Publishers. 3) Personal communication, Peter Rossington BSc (Hon), MRSC, Chemical Consultant. 2005. 4) Espinosa AJ, Rodriquez MT, Barragan de la Rosa FJ et al. Size distribution of metals in urban aerosols in Seville (Spain). Atmos Environ 2001; 35: 2595-2601. 5) Baek SO, Field RA, Goldstone ME et al. A review of atmospheric polycyclic aromatic hydrocarbons: sources, fate and behaviour. Water, Air Soil Pollution, 1991; 60: 279-300. 6) Pistikopoulos P, Mascelet P, Mouvier G. A receptor model adapted to reactive species �C polycyclic aromatic hydrocarbons -evaluation of source contributions in an open urban site. Atmos Environ A-Gen 1990; 24: 1189-97. 7) Venkataraman C, Friedlander SK. Source resolution of fine particulate polycyclic aromatic hydrocarbons �C using a receptor model modified for reactivity. J Air Waste Management; 1994; 44: 1103-08. 8) Zmirou D, Masclet P, Boudet C, Dechenaux J. Personal exposure to atmospheric polycyclic hydrocarbons in a general adult population and lung cancer assessment. J Occup Environ Med 2000; 42(2): 121-6. 2.4 Organic Pollutants 9) Kerkvliet NI. Immunotoxicology of dioxins and related compounds. In Schecter, Dioxins and Health p 199-225. 10) Whyatt RM, Santella RM, Jedrychowski W et al. Relationship between ambient air pollution and DNA damage in Polish mothers and newborns. Environ Health Perspect, 1998; 106 Suppl 3: 821-6 11) Porterfield SP. Vulnerability of the developing brain to thyroid abnormalities and environmental insults to the thyroid system. Environ Health Perspect 1994; 102 Supp 2: 125-30. 12) Peters JM, Thomas D, Falk H et al. Contribution of metals to respiratory cancer. Environ Health Perspect 1986;70: 71-83. 13) Gottscalk LA, Rebello T, Buchsbaum MS et al. Abnormalities in hair trace elements as indicators of aberrant behaviour. Comp Pyschiatry 1991; 32 (3): 229-37. 14) Tong S, Baghurst P, McMichael A et al. Lifetime exposure to environmental lead and children��s intelligence at 11 �C 13 years: the Port Pirie Cohort Study. BMJ 1996; 312 (7046): 1569-75. 15) Sedman RM, Esparza JR. Evaluation of the public health risks associated with semivolatile metal and dioxin emissions from hazardous waste incinerators. Environ Health Perspect 1991; 94: 181-7. 16) Ericksson P, Jakobsson E, Fredriksson A. Brominated flame retardants: A novel class of developmental neurotoxicants in our environment? Environ Health Perspect, 2001; 109(1): 903-908. 17) Olsson P-E, Borg B, Brunstrom B, Hakansson H, Klasson-Wehler E. Endocrine disrupting substances. ISBN 91-620-4859-7, Swedish EPA, Stockholm 1998. Section 3. Health effects of Pollutants 3.1 Particulates 18) WHO Air Quality Guidelines, 1999, Chapter 3. 19) Dockery DW, Pope Ca 3rd, Xu X et al. An association between air pollution and mortality in six US cities. N Eng J Med 1993; 329(24): 1753-9. 20) Pope CA, Thun MJ, Namboodiri MM et al. Particulate air pollution as a predictor of mortality in a prospective study of US adults. Am J Respir Crit Care Med 1995; 151 (3 pt 1): 669-74. 21) de Hartog JJ, Hoek G, Peters A, et al. Effects of fine and ultrafine particles on cardiorespiratory symptoms in elderly subjects with coronary heart disease: the ULTRA Study. Am J Epidemiology 2003; 157(7): 613-23. 22) Nemmar A, Hoet PH, Vanquickenborne B et al. Passage of inhaled particles into the blood circulation in humans. Circulation 2002; 105(4): 411-4. 23) Maynard RL, Howard CV, Air Pollution and Health, London: Academic Press 1999: 673-705. 24) Ponka A, Virtanen M. Asthma and air pollution in Helsinki. J Epidemiol Community Health 1996; 50 Suppl 1: s59-62. 25) Particulate Matter: Properties and Effects upon Health, BIOS Scientific Publishers Ltd, Oxford p 63-84. 26) Airborne Particulate Matter in the United Kingdom. Third Report of the Quality of Air Review Group (QUARG) May 1996, ISBN 0 9520771 3 2. 27) Goldberg MS, Burnett RT, Bailar JC et al. The association between daily mortality and ambient air particle pollution in Montreal, Quebec. 2. Cause-specific mortality. Environ Res 2001: 86(1): 26-36. 28) Pope CA, Burnett RT, Thun MJ, et al. Lung cancer, cardiopulmonary mortality, and long-term exposure to fine particulate air pollution. JAMA 2002; 287(9): 1132-41. 29) Whitman v American Trucking Assoc Inc 532 US 457 (2001). 30) Re-analysis of the Harvard Six Cities Study and the American Cancer Society Study of Particulate Air Pollution and Mortality: Special Report. Cambridge, Mass: Health Effects Institute July 2000, led by Dr Daniel Kreweski. 31) Ostro B, Chestnut L. Assessing the benefits of reducing particulate matter and pollution in the United States. Environ Res 1998; 76(2): 94-106. 32) Pope CA, Bumett RT, Thurston GD et al. Cardiovascular Mortality and Long-Term Exposure to Particulate Air Pollution: Epidemiological Evidence of General Pathophysiological Pathways of Disease. Circulation 2004; 109: 71-77. 33) Miller KA, Siscovick DS, SheppardL, et al. Long term exposure to air pollution and incidence of cardiovascular events in women. N Eng J Med 2007, 356:447-458 34) Peters A, Dockery DW, Muller JE et al. Increased particulate air pollution and the triggering of myocardial infarction. Circulation 2001; 103 (23): 2810-5. 35) Hong YC, Lee JT, Kim H, Kwon HJ. Air pollution: a new risk factor in ischemic stroke mortality. Stroke 2002; 33(9): 2165-9. 36) Hoek G, Brunekreef B, Fischer P et al. The association between air pollution and heart failure, arrhythmia, embolism, thrombosis and other cardiovascular causes of death in a time series. Epidemiology 2001; 12(3): 355-7. 37) Maheswaran R, Haining RP, Brindley P et al. Outdoor air pollution and Stroke in Sheffield, United Kingdom, Small-Area Geographical Study. Stroke 2005; 36(2): 239-43. 38) Schwartz J. Air pollution and hospital admissions for heart disease in eight US counties. Epidemiology 1999; 10(1): 17-22. 39) Baccerelli A, Martinelli I, Zanobetti A et al. Exposure to particulate air pollution and risk of deep venous thrombosis. Arch Int Med 2008; 168(9):920-7 40) Zanobetti A, Schwartz J. Cardiovascular damage by airborne particles: are diabetics more susceptible? Epidemiology 2002; 13(5): 588-92. 41) Peters A, Liu E, Verrier RL et al. Air pollution and incidence of cardiac arrhythmia. Epidemiology 2000; 11(1): 11-7. 42) Pekkanen J, Peters A, Hoek G, et al. Particulate air pollution and risk of ST segment depression during submaximal exercise tests among subjects with coronary heart disease: the Exposure and Risk Assessment for Fine and Ultrafine Particles in Ambient Air (ULTRA) study. Circulation 2002; 106: 933-38. 43) Goldberg MS, Burnett RT, Bailar JC 3rd et al. Identification of persons with cardiorespiratory conditions who are at risk of dying from the acute effects of ambient air particles. Environ Health Perspect 2001; 109 Supp 4: 487-94. 44) Perera FP, Tang D, Tu YH et al. Biomarkers in maternal and newborn blood indicate heightened fetal susceptibility to procarcinogenic DNA damage. Environ Health Perspect 2004; 112(10): 1133-6. 45) Jedrychowski W, Bendkowska I, Flak E et al. Estimated risk for altered fetal growth resulting from exposure to fine particles during pregnancy: an epidemiologic prospective cohort study in Poland. Environ Health Perspect 2004; 112(14): 1398-1402. 46) Perera FP, Rauh V, Whyatt RM et al. Molecular evidence of an interaction between prenatal environmental exposures and birth outcomes in a multiethnic population. Environ Health Perspect 2004; 112(5): 626-30. 47) Somers CM, McCarry BE, Malek F et al. Reduction of particulate air pollution lowers the risk of heritable mutations in mice. Science 2004; 304(5673): 1008-10. 48) Burden of disease attributable to selected environmental factors and injury among children and adolescents in Europe (no authors listed). Child Care Health Dev 2004; 30(6): 731-732. 49) Morgan G, Corbett S, Wlodarczyk J. Air pollution and hospital admissions in Sydney, Australia, 1990-1994. Am J Public Health 1998; 88(12): 1761-60. 50) Vichit-Vadakan N, Ostro BD, Chestnut LG et al. Air pollution and respiratory symptoms: result from three panel studies in Bangkok, Thailand. Environ Health Perspect 2001; 109 Supp3: 381-7. 51) Dockery DW, Speizer FE, Stram DO et al. Effects of inhalable particles on respiratory health of children. Am Rev Respir Dis 1989; 139(3): 587-94. 52) Brauer M, Hoek G Van Vliet P et al, Air pollution from traffic and the development of respiratory infections and asthmatic and allergic symptoms in children. Am J Respir Crit Care 2002; 166(8): 1092-8. 53) Seaton A, MacNee W, Donaldson K et al. Particulate air pollution and acute health effects. Lancet 1995; 345(8943): 176-8. 54) Boezen HM, van der Zee SC, Postma DS et al. Effects of ambient air pollution on upper and lower respiratory symptoms and peak expiratory flow in children. Lancet 1999; 353 (9156): 874-8. 55) Gilliland FD, Berhane K, Rappaport EB et al. The effects of ambient air pollution on school absenteeism due to respiratory illness. Epidemiology 2001: 12(1): 43-54. 56) Peters A, Dockery DW, Heinrich J, Wichmann HE. Short term effects of particulate air pollution on respiratory morbidity in asthmatic children. Eur Respir J 1997; 10(4): 872-9. 57) Gauderman WJ, McConnell R, Gilliland F et al. Association between air pollution and lung function growth in Southern Californian children. Am J Respir Crit Care Med 2000; 162 (4 Pt 1); 1383-90. 58) Brunekreef B, Hoek G. The relationship between low-level air pollution and short-term changes in lung function in Dutch children. J Expo Anal Environ Epidemiol 1993; 3 Suppl 1: 117-28. 59) Gauderman WJ, Gilliland GF, Vora H, et al. Association between air pollution and lung function growth in Southern Californian children: results from a second cohort. Am J Respir Crit Care Med 2002; 166(1): 76-84. 60) Samet JM, Dominici F, Curriero FC et al. Fine particulate air pollution and mortality in 20 US cities 1987-1994. N Eng J Med 2000; 343(24): 1742-9. 61) Schwartz J, Laden F, Zanobetti A. The concentration-response relation between PM2.5 and daily deaths. Environ Health Perspect 2002; 110(10): 1025-9. 62) Stolzel M, Breitner S Cyrys J et al. Daily mortality and particulate matter in different size classes in Erfurt, Germany. J Expo Sci Environ Epidemiol.Research, 2007; 17(5): 459-67 63) Kettunen J, Lanki T, Tiittanen P et al. Associations of fine and ultrafine particulate air pollution with stroke mortality in an area of low pollution levels. Stroke, 2007; 38(3): 918-22 64) Li N, Sioutas C, Cho A et al. Ultrafine particulate pollutants induce oxidative stress and mitochondrial damage.Environ Health Perspect 2003,111:455-460 65) Oberdorster G, Sharp Z Atudorei V et al. Translocation of inhaled ultrafine particles to the brain.Inhalation Toxicology, 2004, 16:437-445 66) Air Quality Guidelines for Europe, Section 7.3 p19, Second Edition, World Regional Publications, Regional European Series No 91, World Health Organisation, Regional Office for Europe, Copenhagen. 67) Annesi-Maesano I, Forastiere F, Kunzli N et al. Partciculate matter, Science and EU Policy. Eur Resp J 2007; 29: 428-431 3.2 Heavy Metals 68) Proceedings of the Third Colloquium on Particulate Air Pollution and Human Health 6-8 June 1999, Durham, North Carolina, Irvine, CA: Air Pollution Effects Laboratory, University of California,1999, 11/23. 69) Pope CA 3rd. Respiratory disease associated with community air pollution and a steel mill, Utah Valley. Am J Public Health, 1989, 79(5): 623-8. 70) Costa DL, Dreher KL. Bioavailable transition metals in particulate matter mediate cardiopulmonary injury in healthy and compromised animal models. Environ Health Perspect 1997;105 (suppl 5): 1053-60 71) Dye JA, Lehmann JR, McGee JK et al. Acute pulmonary toxicity of particulate matter filter extracts in rats: Coherence with epidemiologic studies in Utah Valley. Environ Health Perspect 2001; 109 Suppl 3: 395-403. 72) Hutzinger O, Fielder H. Formation of Dioxins and Related Compounds in Industrial Processes. Pilot Study of International Information Exchange on Dioxins and Related Componds. No 173. Brussels: NATO Committee on Challenges to Modern Science, 1998 73) Rowat SC. Incinerator toxic emissions: a brief summary of human health effects with a note on regulatory control. Med Hypotheses 1999; 52(5): 389-96. 74) Casdorph R, Walker M. Toxic Metal Syndrome, New York: Avery Publishing Group 1995. 75) Ehmann WD, Markesbery WR, Alauddin M et al. Brain trace elements in Alzheimer��s disease. Neurotoxicology 1986; 7 (1): 195-206. 76) Thompson CM, Markesbery WR, Ehmann WD et al. Regional trace-element studies in Alzheimer��s disease. Neurotoxicology 1988; 9(1): 1-7. 77) Wenstrup D, Ehmann WD, Markesbery WR. Trace element imbalances in isolated subcellular fractions of Alzheimer��s disease brains. Brain Res 1990; 533(1): 125-31. 78) Schettler T. Toxic threats to neurological development of children. Environ Health Perspect 2001; 109 (Suppl 6): 813-6. 79) Grandjean P, Weihe P, White RF et al. Cognitive deficit in 7-year old children with prenatal exposure to methyl mercury. Neurotoxicol Teratol 1997; 19(6): 417-28. 80) Palmer RF, Blanchard S, Stein Z et al. Environmental mercury release, special education rates, and autism disorder: an ecological study of Texas. Health Place, 2006;12(2): 203-9 81) Palmer RF, Blanchard S, Wood R. Proximity to point sources of environmental mercury release as a predictor of autism prevalence. Health Place, 2008; doi:10.1016/j.healthplace.2008.02.001 82) Thun MJ, Schnorr TM, Smith AB, et al. Mortality among a cohort of US cadmium production workers �C an update. J Natl Cancer Inst 1985; 74(2): 325-33. 83) Blot WJ, Fraumeni JF Jnr. Arsenical air pollution and lung cancer. Lancet 1975; 2 (7926):142-4. 84) Severs R, Whitehead L, Lane R. Air quality correlates of chronic disease mortality: Harris County, Texas 1969-71. Tex Rep Biol Med 1978; 36: 169-84. 85) Wecker L, Miller SB, Cochran SR et al. Trace element concentration in hair from Autistic Children. J Ment Defic Res 1985: 29 (pt 1): 15-22. 86) Capel ID, Pinnock MH, Dorrell HM, et al. Comparison of concentrations of some trace, bulk, and toxic metals in the hair of normal and dyslexic children. Clinic Chem 1981: 27(6): 879-81. 87) Brockel BJ, Cory-Slechta DA. Lead, attention, and impulsive behaviour: changes in a fixed waiting-for-reward paradigm. Pharmacol Biochem Behav 1998: 60(2): 545-52. 88) David OJ, Hoffman SP, Sverd J, et al. Lead and hyperactivity: Behavioural response to chelation. Am J Psych 1976; 133(10): 1155-8. 89) Masters RD. Biology and politics: linking nature with nurture. Ann Rev Polit Sci 2001; 4: 345-65. 90) Leviton A, Bellinger D, Allred EN et al. Pre and postnatal low-level lead exposure and children��s dysfunction in school. Environ Res 1993: 60(1): 30-43. 91) Eppright TD, Sanfacon JA, Horwitz FA. Attention deficit hyperactivity disorder, infantile autism and elevated blood lead: a possible relationship. Mol Med 1996: 93(3): 136-8. 92) Needleman HL, Gunnoe C, Leviton A et al. Deficits in psychologic and classroom performance in children with elevated dentine lead levels. N Eng J Med 1994; 331(13): 689-95. 93) Bellinger D, Leviton A, Waternaux C, et al. Longitudinal analyses of prenatal and postnatal lead exposure and early cognitive development. N Eng J Med 1987; 316 (17): 1037-43. 94) Needleman HL, Riess JA, Tobin MJ, et al. Bone lead levels and delinquent behaviour. JAMA 1996; 275 (5); 363-9. 95) Mispelstraat: Living under the smoke of a waste incinerator. Report on the health impact of the MIWA waste incinerator in Sint Niklaas, Belgium. www.milieugezondheid. 96) Schauss AG. Comparative hair-mineral analysis results of 21 elements in a random selected behaviourally ��normal�� 19-59 year old population and violent adult criminal offenders. Int J Biosoc Res 1981; 1: 21-41. 97) Bowdler NC, Beasley DS, Fritze EC et al. Behavioural effects of aluminium ingestion on animal and human subjects. Pharmacol Biochem Behav 1979: 10(4): 502-12. 98) Trapp GA, Miner GH, Zimmerman RL et al. Aluminium levels in the brain in Alzheimer��s disease. Biol Pyschiatry 1978; 13(6): 709-18. 99) Multhaup G. Amyloid precursor protein, copper and Alzheimer��s disease. Biomed Pharmocother 1997: 51(3): 105-11. 100) Zapatero MD, Garcia de Jalon A, Pascual F, et al. Serum aluminium levels in Alzheimer��s disease and other senile dementias. Biol Trace Elem Res 1995; 47 (1-3): 235-40. 101) Martyn CN, Barker DJ, Osmond C et al. Geographical relationship between Alzheimer��s disease and aluminium in drinking water. Lancet 1989; 1(8763): 59-62. 102) Crapper DR, Krishnan SS, Dalton AJ et al. Brain aluminium distribution in Alzheimer��s disease and experimental neurofibrillary degeneration. Science 1973: 180(85): 511-3. 103) Neri LC, Hewitt D. Alzheimer��s disease and drinking water. Lancet 1991; 338 (8763): 390. 104) Zayed J, Ducic S, Campanella G, et al. Environmental factors in the etiology of Parkinson��s disease. Can J Neurol Sci 1990: 17(3): 286-91. 3.3 Nitrous Oxides 105) Richters A, Richters V. A new relationship between air pollutant inhalation and cancer. Arch Environ Health 1983; 38(2): 69-75. 106) Ruaslahti E. How cancer spreads. Scientific American Sept 1996: 72-77. 107) Andersen HR, Spix C, Medina S, et al. Air pollution and daily admissions for chronic obstructive pulmonary disease in 6 European cities: results from the APHEA project. Eur Resp J 1997; 10(5): 1064-71. 108) Sunyer J, Spix C, Quenel P, et al. Urban air pollution and emergency admissions for asthma in four European cities: the APHEA Project. Thorax 1997; 52(9): 760-5. 109) Ostro BD, Broadwin R, Lipsett MJ. Coarse and fine particles and daily mortality in the Coachella Valley, California: a follow-up study. J Exp Anal Environ Epidemiol 2000; 10(5): 412-9. 110) Breslin K. The impact of ozone. Env Health Perspectives 1995; 103(7-8): 660-4. 111) Hoek G, Schwartz JD, Groot B, Eilers P. Effects of ambient particulate matter and ozone on daily mortality in Rotterdam, The Netherlands. Arch Environ Health 1997; 52(6): 455-63. 3.4 Organic Toxicants 112) Den Hond E, Roels HA, Hoppenbrouwers K et al. Sexual maturation in relationship to polychlorinated aromatic hydrocarbons: Shape and Skakkebaek��s hypothesis revisited. Environ Health Perspect 2002; 110(8): 771-6. 113) Eskenazi B, Mocarelli P, Warner M et al. Serum dioxin concentrations and endometriosis: a cohort study in Sevenso, Italy. Environ Health Perspect 2002; 110(7): 629-34. 114) Wolff MS, Weston A. Breast cancer risk and environmental exposures. Environ Health Perspect 1997; 105(Suppl 4): 891-6. 115) Hoyer AP, Granjean P, Jorgensen T et al. Organochlorine exposure and the risk of breast cancer. Lancet 1998; 352 (9143): 1816-20. 116) Oliva A, Spira A, Multigner L et al. Contribution of environmental factors to the risk of male infertility. Hum Reprod 2001; 16(8): 1768-76. 117) Sultan C, Balaguer P, Terouanne B et al. Environmental xenoestogens, antiandrogens and disorders of male sexual differentiation. Mol Cell Endocrinol 2001; 178 (1-2): 99-105. 118) Hardell L, van Bavel B, Lindstrom G et al. Increased concentrations of polychlorinated biphenyls, hexachlorobenzene and chlordanes in mothers of men with testicular cancer. Environ Health Perspect 2003; 111 (7): 930-4. a) Organochlorines 119) Jay K, Stieglitz L. Identification and quantification of volatile organic components in emissions of waste incineration plants. Chemosphere 1995; 30: 1249-1260 120) Ecocyle Commission of the Government of Sweden. PVC: A Plan to Prevent Environmental Impact. Stockholm: Ecocycle Commission 1994 121) American Public Health Association. Resolution 9304: Recognizing and addressing the environmental and occupational health problems posed by chlorinated organic chemicals. Am J Public Health 1994; 84:514-5 122) Thornton J, Pandora��s Poison, 2000, MIT Press, Cambridge, Massachusetts & London 123) US Enironmental Protection Agency. Estimating exposure to 2,3,7,8 TCDD. Nal Review Draft. Washington DC: US EPA, Office of Research and Development (EPA/600-6-99-007A), 1988 124) Tatsukawa R, Tanabe S. Fate and bioaccumulation of persistent organochlorine compounds in the marine environment. In: Baumgartner DJ, Dudall IM, eds. Oceanic Processes in Marine Pollution, Volume 6, Malabar FL: Kreiger, 1990:39-55 125) Frank H, Norokorpi Y SchollH et al. Trichloroacetate levels in the atmosphere and in conifer needles in Central and Northern Europe. Organohalogen Compounds 1993,14:307-8 126) Norstom R, Muir DCG. Chlorinated hydrocarbon contaminants in arctic marine mammals. Science of the Total Environment, 1994; 154:107-128 127) Arctic Monitoring and Assessment Programme. Arctic Pollution Issues: A state of the Arctic Environment Report. Oslo:AMAP Directorate, 1997 b) Dioxins 128) BrzuzyLP, Hites RA. Global mass balance of polychlorinated dibenzo-p-dioxins and dibenzofurans. Environmental Science and Technology, 1996, 30:1797-1804 129) US Environmental Protection Agency. The Inventory of sources of dioxin in the United States (Review Draft). Washington DC: US EPA Office of Research and Development (EPA/ 600/p-98-002a), 1998 130) Thomas V, Shapiro C. An estimation of dioxin emissions in the United States. Toxicology and Environmental Chemistrty, 1995; 50:1-37 131) Davis DL, Dinse GE, Hoel DG. Decreasing cardiovascular disease and increasing cancer among whites in the United States from 1973 through 1987. JAMA, 1994; 271:431-437 132) Tritscher AM, Clark GS, Lucier GW. Dose-response effects of dioxins:Species comparison and implications for risk assessment. In: Schecter A, Dioxins and Health. New York:plenum, 1994:227-248130) 133) Neubert R, Jacob-Muller U, Helge H et al. Polyhalogenated dibenzo-p-dioxins and dibenzofurans and the immune system: In vitro effects of 2,3,7,8 tetrachlorodibenzo-p-dioxin (TCDD) on lymphocytes of venous blood from a man and a non-human primate. Archives of Toxicology 1991;65:213-9 134) US Environmental Protection Agency. Health Assessment Document for 2,3,7,8 �C tetrachlorodibenzo-p-dioxin and Related Compounds, Volumes 1-3, Review Draft. Washington DC:US EPA Office of Research and Development (EPA/600/BP-92-001),1994 135) Becher H, Steindorf K, Flesch-Janys D. Quantitative cancer risk assessment of dioxins using an occupational cohort. Env Health Perspect 1998; 106(Suppl 2): 663-670 136) Papke O. PCDD/F:Human background data from Germany, a 10 year experience. Env Health Perspect, 1998; 106 (Suppl 2): 723-31 137) Schecter A, Startin J, Wright C et al. Congener-specific levels of dioxins and dibenzofurans in US food and estimated daily dioxin toxic equivalent intake. Env Health Perspect 1994; 102: 962-966 138) Schecter A, Gasiewicz T. Health hazard assessment of chlorinated dioxins and dibenzofurans contained in human milk. Chemosphere 1987; 16:2147-54 139) Gray LE, Ostby JS, Kelce WR. A dose-response analysis of the reproductive effects of a single gestational dose of 2,3,7,8 tetrachlorodibenzo-p-dioxin in male Long Evens hooded rat offspring. Toxicology and Applied pharmacology, 1997; 146: 11-20 140) Theobald HM, Peterson RE. Developmental and reproductive toxicity of dioxins and other Ah receptor agonists. In: Schecter A, ed. Dioxins and Health. New York: Plenum. 1994:309-46 141) Seegal RF, Schantz SL. Neurochemical and behavioural sequelae of exposure to doxins and PCBs. In: Schecter A, ed. Dioxins and Health. New York: Plenum. 1994:409-448 142) Quass U, Fermann M, Broker G, European Dioxin Inventary Volume 3, Assessment of dioxin emissions until 2005,. Prepared by North Rhine Westphaliam State Environmental Agency on behalf of the European Commission, Directorate General for Environment (DG ENV) 3.5 Effects on genetic Material 143) Tomatis L. Transplacental Carcinogenesis. Lyon, International Agency for Research on Cancer, IARC Scientific Publications No 4 pp100-111. 144) Tomatis L, Goodall CM. The occurrence of tumours in F1, F2 and F3 descendants of pregnant mice injected with 7,12 dimethylbenz(a)anthracene. Int J Cancer 1969; 4(2): 219-25. 3.6 Effects on Immune System 145) Ross P, de Swart, Visser I, et al. Relative immunocompetence of the newborn harbor seal, Phoca vitulina. Veterinary Immunology and Immunopathology 1994; 42(3-4): 331-48. 146) Ross P, de Swart R, Reijnders P, et al. Contaminant-related suppression of delayed-type hypersensitivity and antibody responses in harbor seals fed herring from the Baltic Sea. Env Health Perspect 1995; 103 (2): 162-7. 147) De Swart R. Impaired immunity in seals exposed to bioaccumulated environmental contaminants, PhD Thesis, Erasmus University, Rotterdam, Netherlands, 1995. 148) Lahvis G, Wells RS, Kuehl DW et al. Decreased lymphocyte response in free-ranging bottle-nosed dolphins (Tursiops truncatus) are associated with increased concentration of PCBs and DDT in peripheral blood. Env Health Perspect 1995; 103(4): 67-72. 149) Cone JE,Harrison R, Reiter R. Patients with multiple chemical sensitivities: clinical diagnostic subsets among an occupational health clinic population. In Cullen M (ed) Workers with Multiple Chemical Sensitivities, Occupational Medicine: State of the Art Review 1987; 2(4):721-738 . 150) Sharma R. Immunological Considerations in Toxicology, Vols 1 and 2 (1981), CRC Press, Boca Raton, FL. 151) Ashford N, Miller C. Chemical Exposures: Low Levels and High Stakes. John Wiley & Sons 1998. 152) Massolo L, Muller A, Tueros M, et al. Assessment of mutagenicity and toxicity of different-size fractions of air particles from La Plata, Argentina, and Leipzig, Germany. Environ Toxicol 2002; 17(3): 219-31. 153) Kerkvliet NI. Immunotoxicity of dioxins and related chemicals. In: Schecter A, ed. Dioxins and Health. New York: Plenum1994:199-217 154) Tryphonas H. Immunotoxicity of PCBs (Aroclors) in relation to Great Lakes. Environ Health Perspect, 1995; 103 (Suppl 9):35-46 155) Hillam RP, Bice DE, Hahn FF, Scnizelein CT. Effects of acute nitrogen dioxide exposure on cellular immunity after lung immunization. Environ Res 1983; 31(1): 201-11. 3.7 Synergistic Effects 156) Carroll Wilson. Man��s Global Impact on the Environment: A Study of Critical Environmental Problems, MIT Press, Cambridge, Mass 1971. 157) Mokhiber R. The Ecologist 1998; 28(2): 57-8. 158) Harrison PT, Heath JC. Apparent synergy in lung carcinogenesis: interactions between N-nitrosheptamethyleneimine, particulate cadmium and crocidolite asbestos fibres in rats. Carcinogenesis 1986; 7(11): 1903-8. 159) Wade MG, Foster WG, Younglai EV, et al. Effects of subchronic exposure to a complex mixture of persistent contaminants in male rats: systemic, immune and reproductive effects. Toxicol Sci 2002; 67(1): 131-43. 160) Soto AM, Chung KL, Sonnenschein C. The pesticides endosulphan, toxaphene and dieldrin have estrogenic effects on human estrogen-sensitive cells. Environ Health Perspect 1994; 102(4): 380-3. 161) Abou-Donia MB, Wilmarth KR, Jensen KF et al. Neurotoxicity resulting from co-exposure to pyridostigmine bromide, DEET and permethrin: Implications of Gulf War chemical exposures. J Toxicol Env Health 1996; 48(1): 35-56. 162) Ershoff BH. Synergistic toxicity of food additives in rats fed a diet low in dietary fibre. J Food Sci 1976; 41: 949-51. 163) Wade MG, Parent S, Finnson KW, et al. Thyroid Toxicity due to a subchronic exposure to a complex mixture of 16 organochlorines, lead, and cadmium. Toxicol Sci 2002; 67(2): 207-18. 164) Arnold SF, Klotz DM, Collins BM, et al. Synergistic activation of estrogen receptors with combinations of environmental chemicals. Science 1996; 272 (5267): 1489-92. 165) Germolec DR, Yang RSH, Ackermann MP et al. Toxicology studies of a chemical mixture of 25 groundwater contaminants: Immunosuppression in B6C3F mice. Fundamental and Applied Toxicology 1991;13: 377-387 166) Li MH, Hansen LG. Enzyme induction and acute endocrine effects in prepubertal female rats receiving environmental PCB/PCDF/PCDD mixtures. Environ Health Perspect 1996; 104(7): 712-22. Section 4. Increased Morbidity and Mortality near Incinerators 4.1 Cancer 167) Elliot P, Shaddick G, Kleinschmidt I etal, Cancer incidence near municipal solid waste incinerators in Great Britain. Brit J Cancer 1996; 73(5): 702-10. 168) Elliot P, Eaton N, Shaddick G et al. Cancer incidence near municipal waste incinerators in Great Britain. Part 2: Histopathological and case note review of primary liver cancer cases. British J Cancer 2000; 82(5): 1103-6. 169) Knox EG, Gilman EA. Migration patterns of children with cancer in Britain. J Epidemiology & Community Health 1998; 52(11): 716-26. 170) Knox EG. Childhood cancers, birthplaces, incinerators and landfill sites. Int J Epidemiology 2000; 29 (3): 391-7. 171): Biggeri A, Barbone F, Lagazio C, et al. Air pollution and lung cancer in Trieste, Italy: Spatial analysis of risk as a function of distance from sources. Environ Health Perspect 1996; 104 (7): 750-4. 172) Viel JF, Arveux P, Baverel J, et al. Soft tissue sarcoma and non Hodgkin��s lymphoma clusters around municipal solid waste incinerators with high dioxin emission levels. Am J Epidemiology 2000; 152(1): 13-19. 173) Ohta S, Kuriyama S, Nakao et al. Levels of PCDDs, PCDFs and non-ortho coplanar PCBs in soil collected from high cancer-causing area close to batch-type municipal solid waste incinerator in Japan. Organohalogen Compounds 1997; 32: 155-60. 174) Comba P, Ascoll V, Belli S et al Risk of soft tissue sarcomas and residence in the neighbourhood of an incinerator of industrial wastes. Occup Environ Med 2003; 60(9): 680-3 175) Zambon P, Ricci P, Bovo E et al. Sarcoma risk and dioxin emissions from incinerators and industrial plants: a population-based case-control study (Italy). Environ Health 2007; 6: 176) Gustavsson P. Mortality among workers at a municipal waste incinerator. Am J Ind Med 1989; 15(3): 245-53. 177) Gustavsson P, Evanoff B, Hogstedt C. Increased risk of esophageal cancer among workers exposed to combustion products. Archives Environ Med 1993; 48(4): 243-5. 4.2 Birth Defects 178) ten Tusscher GW, Stam GA, Koppe JG. Open chemical combusting resulting in a localised increased incidence of orofacial clefts. Chemosphere 2000; 40(9-11): 1263-70. 179) Van Lorebeke N. Health effects of a household waste incinerator near Wilrijk, Belgium. In Health Impacts of Waste Management Policies, Hippocrates Foundation, Kos, Greece, 2000. 180) Cordier S, Chevrier C, Robert-Gnansia E et al. Risk of congenital anomalies in the vicinity of municipal solid waste incinerators. Occup Environ Med 2004: 61(1): 8-15. 181) Dummer TJ, Dickinson HO, Parker L. Adverse pregnancy outcomes around incinerators and crematoriums in Cumbria, North-west England, 1956-93. J Epidemiol Community Health 2003: 57(6): 456-61. 182) Dolk H, Vrijheld M, Armstrong B et al. Risk of congenital anomalies near hazardous-waste landfill sites in Europe: the EUROHAZCON study. Lancet, 1998; 352(9126): 423-7. 183)Elliot P, Briggs D, Morris S et al. Risk of adverse birth outcomes in populations living near landfill sites. BMJ, 2001; 323(7309): 363-8. 184) Croen LA, Shaw GM, Sanbonmatsu L et al. Maternal residential proximity to hazardous waste sites and risk for selected congenital malformations. Epidemiology 1997; 8(4): 347-54. 185) Orr M, Bove F, Kaye W et al. Elevated birth defects in racial or ethnic minority children of women living near hazardous waste sites. Int J Hyg Environ Health, 2002; 205(1-2): 19-27. 186) Johnson BL. A review of the effects of the effects of hazardous waste on reproductive health. Am J of Obstetrics and Gynecology 1999; 181: S12-S16. Section 5. Disease Incidence and Pollution 5.1 Cancer 187) NCI, 1991: ��Cancer Statistics Review 1973-88��, NIH Publications No 91-2789. 188) Tomatis L, Cancer, Causes, Occurrence and Control, IARC Scientific publications 100, (Lyon, France, IARC 1996) 21. 189) Graphs of chemical production: From International Trade Commission, Washington DC. 190) Davies DL, Hoel D, Foxj, Lopez A. International trends in cancer mortality in France, West Germany, Italy, Japan, England and Wales and the USA. Lancet 1990; 336 (8713): 474-81. 191) Pickle LW, Mason TJ, Fraumeni JF Jr. The new United States Cancer Atlas. Recent Results Cancer Res, 1989; 114: 196-207. 192) Najem GR, Louria DB, Lavenhar MA et al. Clusters of cancer mortality in New Jersey municipalities, with special reference to chemical toxic waste disposal sites and per capita income. Int J Epidemiol 1985; 14(4): 528-37. 193) Najem GR, Greer W. Female reproductive organs and breast cancer mortality in New Jersey Counties and the relationship with certain environmental variables. Prev Med 1985: 14(5): 620-35. 194) Hoover R, Fraumeni JF Jr. Cancer mortality in US counties with chemical industries. Environ Res 1975; 9(2): 196-207. 195) Goldman BA. The Truth About Where You Live: An Atlas for Action on Toxins and Mortality. New York: Random House 1991. 196) Zahm SH, Blair A. Cancer among migrant and seasonal farmers: an epidemiologic review and research agenda. Am J of Ind Med 1993; 24(6): 753-66. 197) Tornling G, Gustavsson P, Hogstedt C. Mortality and cancer incidence among Stockholm fire fighters. Amer J Industrial Med 1994: 25(2): 219-28. 198) Zahm SH, Weisenburger DD, Babbitt PA et al. A case control study of non-Hodgkin��s Lymphoma and the Herbicide 2,4 Dichlorophenoxyacetic acid (2,4-D) in Eastern Nebraska. Epidemiology 1990; 1(5): 349-56. 199) Hardell L, Eriksson M, Lenner P et al. Malignant lymphoma and exposure to chemicals, especially organic solvents, chlorophenols and phenoxy acids: a case control study. Brit J Cancer 1981; 43(2): 169-76. 200) Harshbarger JC and Clark JB. Epizootiology of neoplasms in bony fish of North America. Sci Total Environ 1990; 94(1-2): 1-32. 201) Hayes HM Jr, Hoover R, Tarone RE. Bladder cancer in pet dogs: a sentinel for environmental cancer. Am J Epidemiol 1981; 114(2): 229-33. 202) Baumann PC, HarshbargerJC. Decline in liver neoplasms in wild brown bullhead catfish after coking plant closes and environmental PAHs plummet. Environ health Perspect 1995; 103: 168-70. 203) Perera F.P, Hemminki K, Gryzbowska E et al. Molecular and Genetic Damage in Humans from Environmental Pollution in Poland. Nature 1992; 360 (6401): 256-58. 204) Perera FP, Mooney LA, Stamfer M et al. Associations between carcinogen-DNA damage, glutathione S transferase genotypes, and risk of lung cancer in the prospective Physician��s Health Cohort Study. Carcinogenesis 2002; 23(10): 1641-6. 205) Lewis-Michl EL, Melius JM, Kallenbach LR et al. Breast cancer risk and residence near industry or traffic in Nassau and Suffolk Counties, Long Island, New York. Arch Environ Health 1996; 51(4): 255-65. 206) The Long island Breast Cancer Study Reports 1-3 (1988-90), New York State Department of Health, Department of Community and Preventative Medicine, Nassau County Department of Health and Suffolk County Department of Health Services. 207) Aschengrou A, Ozonoff DM. Upper Cape Cancer Incidence Study: Final Report. Boston: Mass. Depts of Public Health and Environment Protection 1991. 208) Aschengrau A, Ozonoff D, Paulu C et al. Cancer risk and tetrachloroethylene-containing drinking water in Massachusetts. Arch Environ Health 1995; 48(5): 284-92. 209) McKelvey W, Brody JG, Aschengrau A et al. Association between residence on Cape Cod, Massachusetts, and breast cancer. Ann Epidemiol 2004; 14(2): 89-94. 210) Fagliano J, Berry M, Boye F et al. Drinking water contamination and the incidence of leukaemia:an ecologic study. Am J Public Health 1990; 80 (10): 1209-12. 211) Cantor KP et al., Water Pollution In Schottenfeld D and Fraumeni JF Jr (eds.), Cancer Epidemiology and Prevention, 2nd ed. Oxford: Oxford Univ Press 1996. 212) Lagakos S.W et al. An analysis of contaminated well water and health effects in Woburn, Massachusetts. J Amer Stat Assoc 1986: 395: 583-96. 213) Osborne J.S, Shy CM, Kaplan BH. Epidemiologic analysis of a reported cancer case cluster in a small rural population. Am J Epidemiol 1990; 132 (Supp 1): S87-95. 214) Lampi P, Hakulinen T, Luostarinen et al. Cancer incidence following chlorophenol exposure in a community in Southern Finland. Arch Environ Health 1992; 47(3): 167-75. 215) IARC Monographs on Evaluation of Carcinogenic Risks to Humans Suppl 7 (Lyon, France: IARC 1987). 216) US.DHHS Seventh Annual Report on Carcinogens, Research Triangle Park, NC:us. Department of Health and Human Services, 1990. 217) Holzman D. Banking on tissues. Environ Health Perspect 1996; 104(6): 606-10. 218) Moses M, Johnson ES, Anger WK et al. Environmental equity and pesticide exposure. Toxicol Ind Health 1993; 9(5): 913-59. 219) Onstot J, Ayling R, Stanley J. Characterization of HRGC/MS Unidentified Peaks from the Analysis of Human Adipose tissue. Volume 1: Technical approach. Washington DC: US Environmental Protection Agency Office of Toxic Substances (560/6-87-002a), 1987 220) Body Burden: Executive Summary, 2003, Environmental Working Group, Mount Sinai School of Medicine and Commonweal. www.ewg.org/reports/bodyburden/ 221) Foster W, Chan S, Platt L, Hughes C. Detection of endocrine disrupting chemicals in samples of second trimester human amniotic fluid. J Clinic Endocrinol Metabol 2000; 85(8): 2954-7. 222) Zieger M. Biomarkers: The clues to genetic susceptibility. Environ Health Perspectives 1994; 102(1): 50-7. 5.2 Neurological Disease 223) Rodier PM. Developing brain as a target of toxicity. Environ Health Perspect 1995: 103 Suppl 6: 73-6. 224) Hattis D, Glowa J Tilson H et al. Risk assessment for neurobehavioural toxicity: SGOMSEC joint report. Env Health Perspect 1996;104 (Suppl 2): 249-71 225) Landrign PJ, Graham DG, Anger WK et al. Environmental toxicology. Washington DC: National Academy Press,1992. 226) WeissB.Risk assessment: The insidious nature of neurotoxicity and the aging brain. Neurotoxicology 1990;11:305-14 227) Knapp et al. Dementia UK: Report to the Alzheimer��s Society, King��s College, London and London School of Economics and Political Science, 2007 228) Pritchard C, Baldwin D, Mayers A. Changing patterns of adult neurological deaths (45-74 years) in the major western world countries (1979-1997). Public Health 2004; 118(4): 268-83. 229) Taylor B, Miller E, Farrington CP et al. Autism and measles, mumps and rubella vaccine: no epidemiological evidence for a causal association. Lancet 1999; 353(9169): 2026-9. 230) Rybicki RA, Johnson CC, Uman J, Gorrell JM. Parkinson��s disease mortality and the industrial use of heavy metals in Michigan. Mov Disord 1993; 8(1): 87-92. 5.3 Mental Disease 231) Strahilevitz M, Strahilevitz A, Miller JE. Air pollutants and the admission rate of psychiatric patients. Am J Psychiatry 1979; 136(2): 205-7. 232) Briere J, Downes A, Spensley J. A. summer in the city: urban weather conditions and psychiatric emergency room visits. J Abnorm Pyschol 1983; 92(1): 77-80. 233) Morrow LA, Kamis H, Hodgson MJ. Psychiatric symptomatology in persons with organic solvent exposure. J Consult Clinic Pyschol 1993; 61(1): 171-4. 234) Morrow LA, Stein L, Scott A et al. Neuropsychological assessment, depression and past exposure to organic solvents. Applied Neuropyschol 2001; 8(2): 65-73. 5.4 Violence and Crime 235) Hall RW. A study of mass murder: evidence of underlying cadmium and lead poisoning and brain-involved immunoreactivity. Int J Bioscoc Med Res 1989; 11: 144-52. 236) Marlowe M, Schneider HG, Bliss LB. Hair mineral analysis in emotionally disturbed and violence prone children. Int J Biosoc Med Res 1991; 13: 169-79. 237) Pihl RO, Ervin F. Lead and cadmium levels in violent criminals. Pyschol Rep 1990; 66(3Pt 1): 839-44. 238) Denno DW. Gender, crime and the criminal law defences. J Crim Law Criminol 1994; 85: 80-180. 239) Deborah Denno. Biology and Violence: From Birth to Adulthood. Cambridge University Press, 1990. 240) Stretesky PB, Lynch MJ. The relationship between lead exposure and homicide. Arch Ped Adolesc Med 2001; 155(5): 579-82. 241) Stretesky PB, Lynch MJ. The relationship between lead and crime. J Health & Soc Behav 2004; 45(2): 214-29. 6. High Risk Groups 6.1 The Foetus 242) Centers for Disease Control. Blood and hair mercury levels in young children and women of childbearing age. United States 1999 Morbidity and Mortality Report, 2001; 50: 140-43. 243) Anderson LM, Diwan BA, Fear NT, Roman E. Critical windows of exposure for children��s health: cancer in human epidemiological studies and neoplasms in experimental animal models. Environ Health Perspect 2000; 108 suppl 3: 573-94. 244) US Environmental Protection Agency, Office of Pollution Protection and Toxic Substances, Chemical Hazard Data Availability Study: What do we really know about high production volume chemicals? USEPA: Washington DC,1998. 245) Sonnenschein C, Soto AM. An Updated review of environmental estrogen and androgen mimics and antagonists. J Steroid Biochem Mol Biol 1998; 65 (1-6): 143-50. 246) Markey CM, Coombs MA, Sonnenschein C, Soto AM. Mammalian development in a changing environment: exposure to endocrine disruptors reveals the developmental plasticity of steroid-hormone target organs. Evol Dev 2003; 5(1): 67-75. 247) Tilson HA, Jacobson JL, Rogan WJ. Polychlorinated biphenyls and the developing nervous system: cross species comparisons. Neurotoxicol Teratol 1990; 12 (3): 239-48. 248) Weisgals-Kuperas N, Patandin S, Berbers GA, et al. Immunological effects of background exposure to polychlorinated biphenyls and dioxins in Dutch preschool children. Environ Health Perspect 2000; 108(12): 1203-7. 249) Rogan WJ, Gladen BC, McKinney JD, et al. Polychlorinated biphenyls (PCBs) and dichlorodiphenyldichloroethene (DDE) in human milk: effects of maternal factor and previous lactation. Am J Public Health 1986; 76(2): 172-7. 250) Body Burden: The Pollution in Newborns: Executive Summary, July 2005, Environmental Working Group, Mount Sinai School of Medicine and Commonweal.www.ewg.org/reports/bodyburden2/execsumm.php 251) A Present for Life: Hazardous chemicals in umbilical cord blood. WWF/Greenpeace, September 2005. www.greenpeace.org/raw/content/international/press/reports/umbilicalcordreport.pdf 6.2 The Breast-fed Infant 252) Jensen AA, Slorach SA. Assessment of infant intake of chemicals via breast milk in Chemical Contaminants in Human Milk. Boca Raton: CRC Press 1991. pp215-22. 253) Koopman-Esseboom C, Huisman M, Weisglas-Kuperus N, et al. Dioxin and PCB levels in blood and human milk in relation to living in the Netherlands. Chemosphere 1994; 29 (9-11): 2327-38. 254) Patandin S, Dagnelie PC, Mulder PG, et al. Dietary exposure to polychlorinated biphenyls and dioxins from infancy until adulthood: a comparison between breast-feeding, toddler and long-term exposure. Environ Health Perspect 1999; 107(1): 45-51. 255) Rogan WJ, Bagniewska A, Damstra T. Pollutants in breast milk. N Engl J Med 1980; 302(26): 1450-3. 256) Jacobson JL, Jacobson SW. Prenatal exposure to polychlorinated biphenyls and attention at school age. J Paediatr 2003; 143(6): 780-8. 257) Jacobson JL, Jacobson SW. Association of prenatal exposure to an environmental contaminant with intellectual function in childhood. J Toxicol Clin Toxicol 2002; 40(4): 467-75. 258) Jacobson JL, Jacobson SW. Intellectual impairment in children exposed to polychlorinated biphenyls in utero. N Eng J Med 1996; 335(11): 783-9. 259) Kinbrough RD. Toxicological implications of human milk residues as indicated by toxicological and epidemiological studies in Jensen AA & Slorach SA: Chemical Contaminants in Human Milk, 1990 pp271-83. 260) Rice DC. Behavioural impairment produced by low-level postnatal PCB exposure in monkeys. Env Res 1999; 80(2 Pt 2): S113-S121. 261) Rice DC. Effects of postnatal exposure of monkeys to a PCB mixture on spatial discrimination reversal and DRL performance. Neurotoxicol Teratol 1998; 20(4): 391-400. 262) Rice DC, Hayward S. Effects of postnatal exposure to a PCB mixture in monkeys on non-spatial discrimination reversal and delayed alternation performance. Neurotoxicology 1997; 18(2): 479-94. 263) Hallgren S, Sinjari T, Hakansson H, Darnerud PO. Effects of polybrominated diphenyl ethers (PBDEs) and polychlorinated biphenyls (PCBs) on thyroid hormone and vitamin A levels in rats and mice. Arch Toxicol 2001; 75(4): 200-8. 264) Hooper K, McDonald TA. The PBDEs: an emerging environmental challenge and another reason for breast milk monitoring programs. Env Health Perspect 2000; 108(5): 387-92. 6.3 Children 265) Moolgavkar SH, Venzon DJ. Two-event model for carcinogenesis: incidence of curves for childhood and adult tumours. Maths Biosci 1979; 47: 55-77. 266) Rodier PM. Chronology of neuron development: animal studies and their clinical implications. Dev Med Child Neurol 1980; 22(4): 525-45. 267) Ekbom A, Hsieh CC, Lipworth L, et al. Intrauterine environment and breast cancer risk in women: a population-based study. J Natl Cancer Inst 1997; 89(1): 71-6. 268) Knox EG. Childhood cancers and atmospheric carcinogens. J Epidemiol Community Health 2005; 59(2): 101-5. 269) Tomatis L, Overview of perinatal and multigeneration carcinogenesis. ARC Sci Publ 1989; 96: 1-15. 270) Anderson LM, Donovan PJ, Rice JM, Risk assessment for transplacental carcinogenesis. In New Approaches in Toxicity Testing and their Application in Human Risk Assessment (ed Li AP). 1985 pp179-202. 271) Landrigan PJ, Garg A. Chronic effects of toxic environmental exposures in children��s health. J Toxicol Clinical Toxicol 2002; 40(4): 449-56. 272) Calabrese E.J. Age and Susceptibility to Toxic Substances. New York, John Wiley & Sons 1986. 273) National Academy of Sciences. Scientific Frontiers in Developmental Toxicology and Risk Assessment. National Academy Press, Washington DC 2000. 274) Windham GC, Zhang L, Gunier R et al. Autism spectrum disorders in relation to distribution of hazardous air pollutants in the San Francisco bay area. Environ Health Perspect 2006;114(9): 1438-44 275) Kenet T et al. Perinatal exposure to a noncoplanar polychlorinated biphenyl alters tonotopy, receptive fields and plasticity in rat primary auditory cortex. Proc Natl Acad Sci USA 2007; 104 (18):7646-51 276) Jacobson JL, Jacobson SW, Humphrey HE. Effects of in utero exposure to polychlorinated biphenyls and related contaminants on cognitive functioning in young children. J Paediatr 1990; 116(1): 38-45. 277) Needleman HL, Leviton A, Bellinger D.Lead-associated intellectual deficit. N Eng J Med 1982; 306(6): 367. 6.4 The Chemically Sensitive 278) Rinsky RA et al. Benzene and leukemia: an epidemiologic risk assessment. N Eng J Med 1987; 316(17): 1044-50. 279) Pelkonenn O. Comparison of activities of drug-metabolizing enzymes in human fetal and adult livers. Clinic Pharmacol Ther 1973; 14(5): 840-6. 280) Hattis D, Russ A, Goble R, et al. Human interindividual variability in susceptibility to airborne particles. Risk Anal 2001; 21(4): 585-99. 281) Friedman R. Sensitive Populations and Environmental Standards. The Conservative Foundation, Washington DC (1981). Section 7. Past Mistakes and the Precautionary Principle 7.1 The Precautionary Principle 282) European Commission 2000. Communications from the Commission on the Precautionary Principle (COM (2000) 1) Brussels. URL: http://europa.eu.int/comm./dgs/health_consumer/library/pub/pub07_en.pdf (accessed 30 November 2003). 283) Grandjean P, Bailar JC, Gee D, et al. Implications of the precautionary principle in research and policy-making. Am J Ind Med 2004; 45(4): 382-5. 284) Franchini M, Rial M, Buiatti E, Bianchi F. Health effects of exposure to waste incinerator emissions: a review of the epidemiological studies. Ann Ist Super Sanita, 2004; 40(1): 101-15. 7.2 Learning from Past Mistakes 285) Rice DC, Evangelista de Duffard AM, Duffard R et al. Lessons for neurotoxicology from selected model compounds SGOMSEC joint report. Env Health Perspect 1996; 104 (Supp 2): 205-15. Section 8. Alternative Waste Technologies 8.2 Producing Less Waste 286) Department of Food, Environment and Rural Affairs (2006); Review of England��s Waste Strategy: A Consultation Document, London, Defra. 287) Energy Green Paper, Towards a European Strategy for the Security of Energy, European Commission,2001. http://europa.eu.int/comm/energy_transport/doc-principal/pubfinal_en.pdf 288) World Energy Outlook 2001, 2001 Insights, International Energy Agency(IEA) and the Organisation for Economic Co-operation and Development ()ECD), 2001. http://library.iea.org/dbtw-wpd/Textbase/npold/npold_pdf/weo2001.pdf 289) Mobbs P, Energy beyond Oil, Cronwell Press Ltd, 2005,Trowbridge, UK 290) Cambridge Econometrics, UK Energy and the Environment. March 2008 8.7 Adavanced Thermal Technologies (ATT) and Plasma Gasification 291) Gomez E, Amutha Rani D, Cheesman CR et al. Theral plasma technology for the treatment of wastes: A critical review, 2008, Journal of hazardous Materials, doi:10.1016/j.hazmat.2008.4.017:1-13 8.8 Greenhouse Gases 292) White P, Franke M, Hindle P. Integrated Solid Waste Management: A Lifestyle Inventory, 1994, Blackie Academic And Professional Section 9. Costs of Incineration 9.1 Direct and Indirect Costs 293) Public Consultation on Waste management Options, Scottish Environmental Protection Agency, Western Isles Strategy Area, Nov 2001 294) Russell M, Colglazier W, Tonn BE. The US hazardous waste legacy. Environment, 1992; 34(6): 13-39 9.2 Health costs of Incineration 295) Energy Technology Support Unit (ETSU), 1996, Economic Evaluation of the draft incinerator Directive, European Commission 296) Final report for DEFRA by Enviros Consulting Ltd in association with ENTEC: Valuation of the External Costs and Benefits to Health and Environment of Waste Management Options. Dec 2004 297) Eshet T, Ayalon O, Schecter M. A Critical Review of Economic Evaluation Studies of Externalities from Incineration and landfilling. Waste management Res, 2005; 23:487-504 298) Miranda ML, Hale B. Waste not, want not, the private and social cost of energy production. Energy Policy, 1997; 25:587-600 9.3 Financial Gains from reducing Pollution 299) Wulf-Schnabel J, Lohse J. Economic evaluation of dust abatement techniques in the European Cement Industry. A report produced for the European Commission, May 1999. 300) Pianin E. Study finds Net Gain from Pollution rules. Washington Post, Sept 27th, 2003. 9.4 Other Studies of the Health Costs of Pollution 301) Muir T, Zegarac M. Societal Costs of Exposure to Toxic Substances: Economic and health Costs of Four Case studies that are Candinates for Environmental Causation. Env Health Perspect 2001; 109 (Suppl 6): 885903 302) World Wildlife Fund Report: Compromising Our Children: Chemical Impacts on Children��s intelligence and Behaviour, June 2004. www.wwf.org.uk/chemicals Section 10. Other Considerations of Importance 10.1 The Problem of Ash 303) Markus T, Behnisch P, Hagenmaier H et al. Dioxinlike components in incinerator fly ash: A comparison between chemical analysis data and results from a cell culture bioassay. Environ Health Perspect 1997; 105(12): 475-81 10.2 Radioactivity 304) Beral V, Rooney C,Maconochie N et al. Case control study of prostatic cancer in Employees of the United Kingdom Atomic EnergyAuthority. BMJ,1993; 307: 1391-7 305) Stokke T, Oftedal P, Pappas A. Effects of a small doses of radioactive strontium on the rat bone marrow. Acta Radiologica 1968: 7:321-9 306) Luning KG, Frolen H, Nelson A. Genetic effects of Strontium 90 injected into male mice. Nature 1963; 197:304-5 307) Busby C, Wings of Death: Nuclear Pollution and Human Health, 1995, Green Audit (Wales) Ltd, Aberystwyth 308) Berd V et al (eds.), Childhood Cancer and Nuclear Installations (London, BMJ Publishing Group 1993). 309) Gardner MJ. Childhood leukaemia around the Sellafield nuclear plant. In P Elliot et al (eds.) Geographical and Environmental Epidemiology: Methods for Small Area Studies. Oxford, Oxford University Press 1992, pp291-309. 310) Heasman MA, Kemp IW, Urquart JD, Black R. Childhood cancer in Northern Scotland. Lancet 1986; 1 (8475): 266. 311) Roman E, Watson A, Beral V, et al. Case control study of leukemia and Non-Hodgkin lymphoma among children aged 0-4 Years living in West Berkshire and North Hampshire health districts. BMJ 1993; 306(6878): 615-21. 312) Morris MS, Knorr RS. Adult leukemia and proximity-based surrogates for exposure to Pilgrim plant��s nuclear emissions. Arch Environ Health 1996; 51(4): 266-74. 313) Clapp RW et al. Leukaemia near Massachusetts nuclear power plant. Lancet 1987; 2(8571): 1324-5. 314) Baker PJ, Hoel DG. Meta-analysis of standardized incidence and mortality rates of childhood leukaemia in proximity to nuclear facilities. Eur J Cancer Care, 2007;16: 355-63 10.3 The Spread of Pollutants 315) National Research Council (2000): Waste Incineration and Public Health ISBN: 0-309-06371-X,Washington DC, National Academy Press. 316) Mittal AK, Van Grieken R, Ravindra.. Health risk assessment of urban suspended particulate matter with special reference to polycyclic aromatic hydrocarbons: a review. Rev Environ Health 2001; 16 (Pt 3): 169-89. 317) Final report to the North American Commission for Environmental Cooperation (Flushing, N.Y.: Centre for the Biology of Natural systems, Queens College, CUNY, 2000). 319) Raloff FJ. Even Nunavut gets plenty of dioxin. Science News 2000; 158 : 230. 10.4 Cement Kilns 319) Personal Communication, Christine Hall, Emission-Watch, Chester www.emission-watch.com Section 11. Monitoring 320) Wang L, His H Chang J et al. Influence of start-up on PCDD/F emission of incinerators. Chemosphere, 2007; 67: 1346-53 321) De Fre and Wevers. Underestimation of Dioxin emission inventories.1998: Organohalogen Compounds 36:17-20 322) Farland W, Lorber M, Clevely D. WTI Screening level analysis. Washington DC: US Environmental Protection Agency Office of Research and Development, February 9, 1993. 323) Wates J. The Non-Governmental Organization and Management of Hazardous Waste in Ireland, 1994, Earthwatch, European Environmental Bureau Section 12. Risk Assessment 324) Alleva E, Brock J, Brouwer A et al. Statement from the work session on environmental endocrine-disrupting chemicals: Neural, endocrine and behavioural effects. Erice, Italy: Ettore Majorana Centre for Scientific Culture, 1995. 325) National Research Council (NRC). Toxicity Testing: Strategies to Determine Needs and Priorities (1984), National Academy Press, Washington, D.C. 326) Moore CF. Silent Scourge: Children, Pollution and Why Scientists Disagree. Oxford University Press, 2003, Oxford 327) Bostock A. Waste Incineration and its Impact upon Health, the Environment and Sustainability, 2005, Acro Logic 328) Schettler T, Solomon G, Valenti M and Huddle A. Generations at Risk: Reproductive Health and the Environment, 1999, MIT Press, Cambridge, Massachusetts, & London. Section 15. Recommendations 329) Friends of the Earth Briefing. Incinerators and Deprivation, Jan 2004. (This article is also available as a booklet. For a copy please contact BSEM)
|
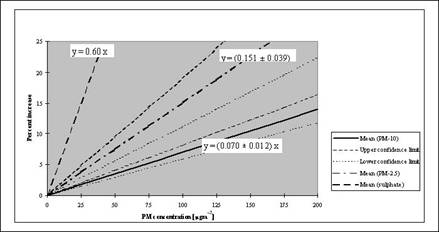
��
��
��
Gas Fired Incinerator,Hospital Medical Waste Incinerator,Incinerators for Medical Waste Disposal,Industrial Incinerator,
Medical Incinerators Capacity Calculations,Msw Incinerator Msw1000,Poultry Incinerator,Small Medical Waste Incinerator,
Temperature Control Incinerator,Diesel and Gas Incinerator 50 Kg Per Hour